Q57 / 75 · JEE Main 2026 (22 January Shift 2) · Physics
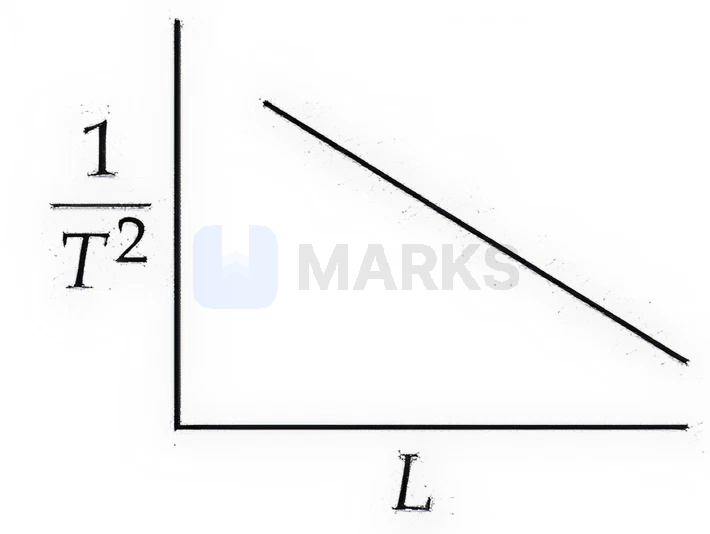
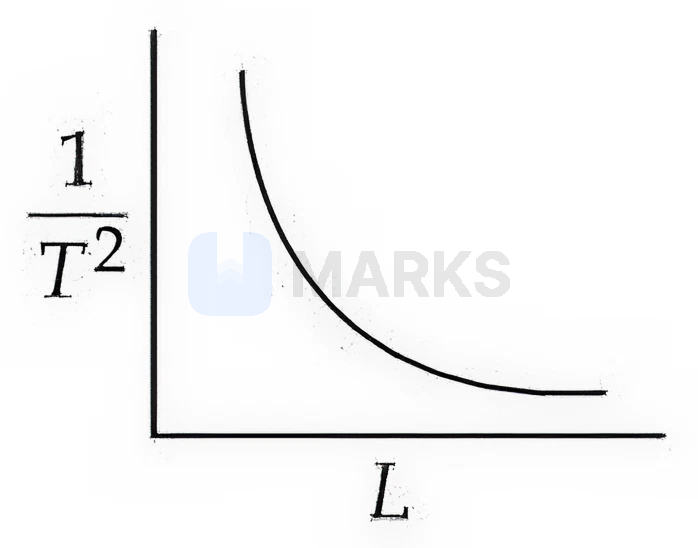
Using a simple pendulum experiment $g$ is determind by measuring its time period $T$. Which of the following plots represent the correct relation between the pendulum length $L$ and time period $T$ ?
- A
- Correct answerB
- C
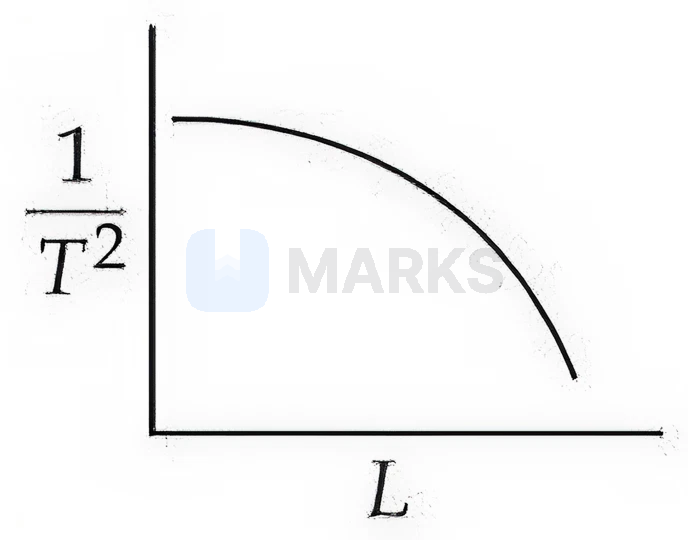
- D
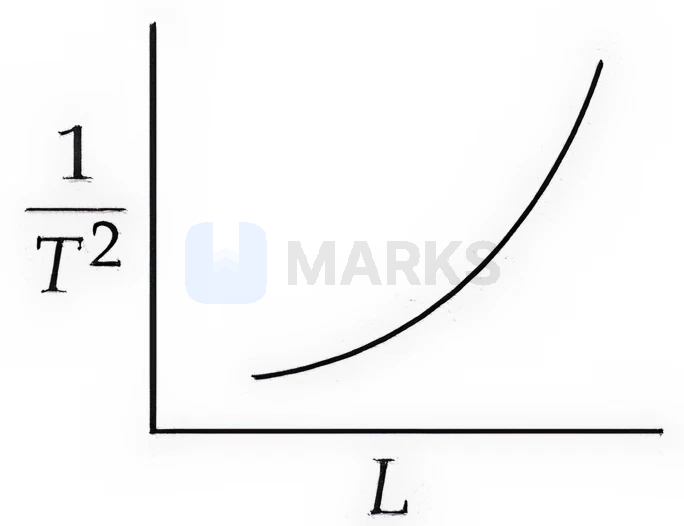
Solution
The time period $T$ of a simple pendulum of length $L$ is given by the formula:
$T = 2\pi \sqrt{\frac{L}{g}}$
Squaring both sides, we get:
$T^2 = 4\pi^2 \frac{L}{g}$
Rearranging the equation to find the relationship between $\frac{1}{T^2}$ and $L$:
$\frac{1}{T^2} = \frac{g}{4\pi^2 L}$
Let $y = \frac{1}{T^2}$ and $x = L$. The equation becomes:
$y = \frac{k}{x}$ where $k = \frac{g}{4\pi^2}$ is a constant.
This is the equation of a rectangular hyperbola in the first quadrant.
As $L$ increases, $\frac{1}{T^2}$ decreases non-linearly, approaching the axes asymptotically.
Comparing this with the given plots, option (2) correctly represents a hyperbolic relationship between $\frac{1}{T^2}$ and $L$.
Hence, the correct answer is option: 'B'.