Q148 / 200 · NEET 2022 (Phase 1) · Physics
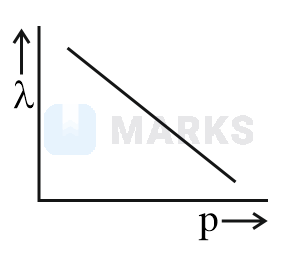
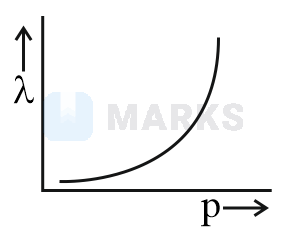
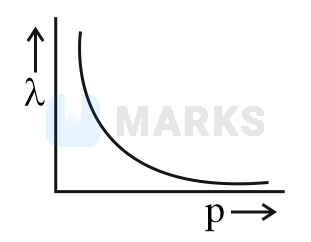
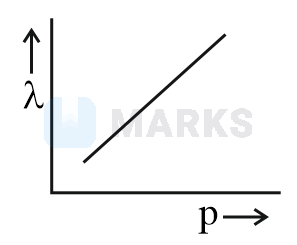
The graph which shows the variation of the de Broglie wavelength of a particle and its associated momentum is :
- A
- B
- Correct answerC
- D
Solution
As per de Broglie,
which is similar to expression.
Hence, the correct answer is option: 'C'.