Q19 / 90 · JEE Main 2021 (01 Sep Shift 2) · Chemistry
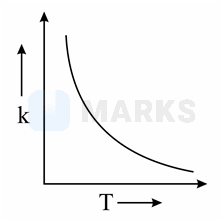
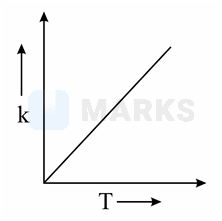
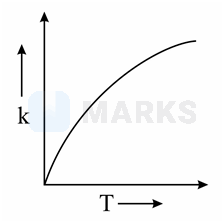
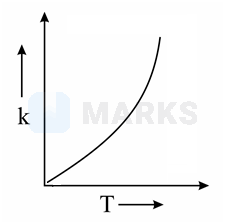
Which one of the following given graphs represents the variation of rate constant with temperature for an endothermic reaction?
- A
- B
- C
- Correct answerD
Solution
Relation between rate constant (k) and absolute temperature (T):
Arrhenius equation:
The value of rate constant (k) will increase exponentially with rise in temperature for all type of reactions.
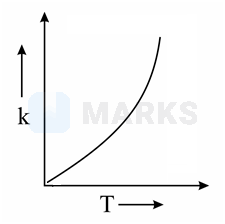
Hence, the correct answer is option: 'D'.