Q76 / 200 · NEET 2024 (Re-NEET) · Chemistry
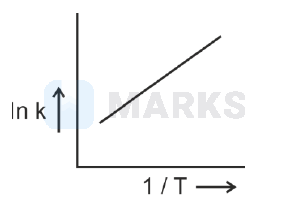
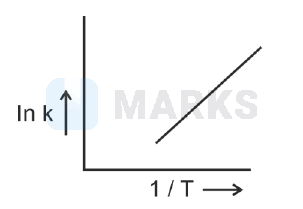
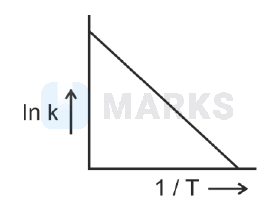
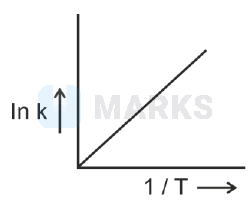
Which of the following plot represents the variation of $\ln \mathrm{k}$ versus $\frac{1}{T}$ in accordance with Arrhenius equation?
- A
- B
- Correct answerC
- D
Solution
Using Arrhenius equation,
$\mathrm{k}=\mathrm{Ae}^{-\mathrm{E}_{\mathrm{a}} / R T}$
$\mathrm{k}=\mathrm{Ae}^{-\mathrm{E}_{\mathrm{a}} / R T}$
$\ln k=\ln A-\frac{E_a}{R T}$
$y=c+m x, \quad$ slope $(m)=-\frac{E_a}{R}$
Intercept $=\ln \mathrm{A}$
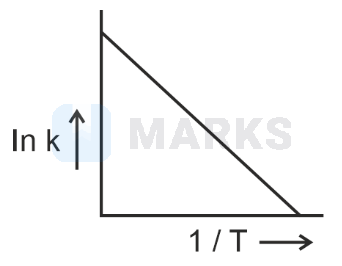
Hence, the correct answer is option: 'C'.