Q1 / 90 · JEE Main 2022 (27 Jun Shift 2) · Chemistry
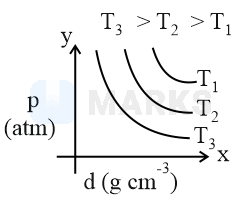
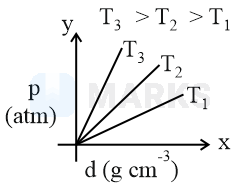
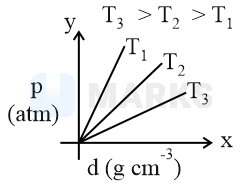
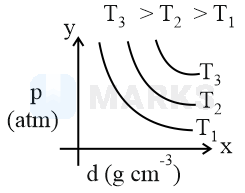
Which amongst the given plots is the correct plot for pressure vs density for an ideal gas?
- A
- Correct answerB
- C
- D
Solution
so Slope
Greater is slope greater is Temperature.
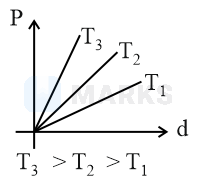
Hence, the correct answer is option: 'B'.