Q165 / 200 · MHT CET - Medical 2026 (21 April Shift 1) · Physics
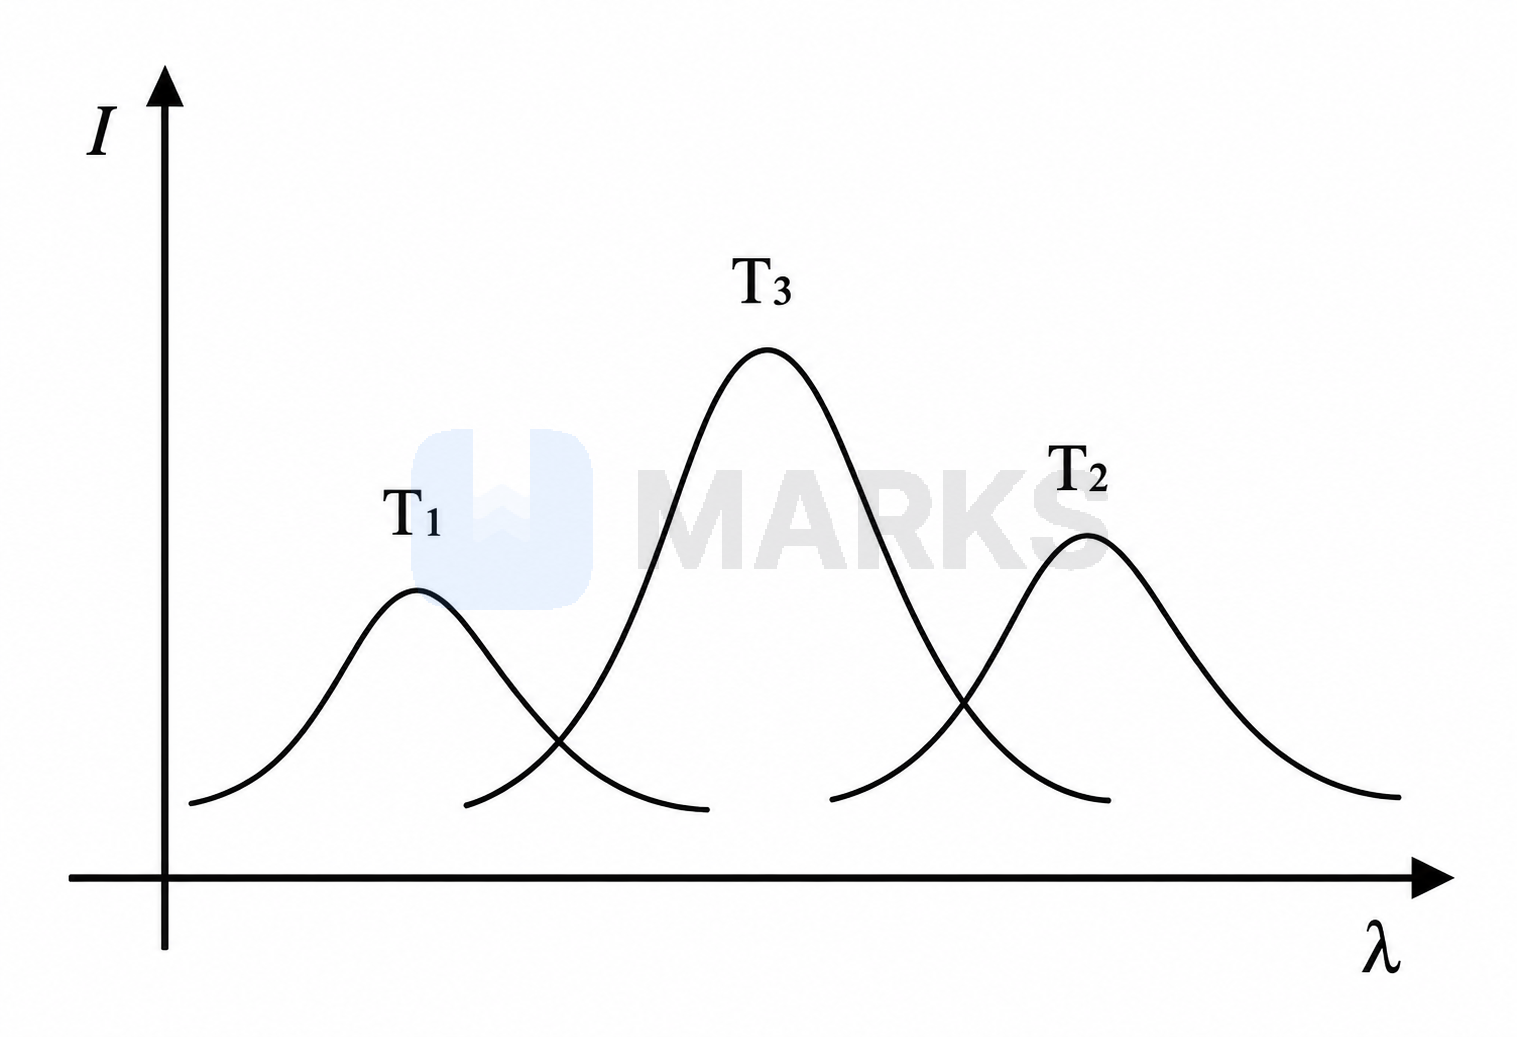
The plots of intensity against wavelength for three black bodies at temperatures $T_1$, $T_2$ and $T_3$ are as shown. The wavelengths are such that
- A$\lambda_1 > \lambda_3 > \lambda_2$
- B$\lambda_1 > \lambda_3 < \lambda_2$
- C$\lambda_1 < \lambda_3 > \lambda_2$
- Correct answerD$\lambda_1 < \lambda_3 < \lambda_2$
Solution
From the given graph, the horizontal axis represents the wavelength $\lambda$.
Let $\lambda_1$, $\lambda_2$, and $\lambda_3$ be the wavelengths corresponding to the maximum intensity (the peaks of the curves) for the black bodies at temperatures $T_1$, $T_2$, and $T_3$ respectively.
By observing the positions of the peaks along the $\lambda$-axis:
The peak of the curve for $T_1$ is furthest to the left, meaning it corresponds to the smallest wavelength, so $\lambda_1$ is the minimum.
The peak of the curve for $T_3$ is in the middle, so $\lambda_3$ is greater than $\lambda_1$.
The peak of the curve for $T_2$ is furthest to the right, meaning it corresponds to the largest wavelength, so $\lambda_2$ is the maximum.
Therefore, the correct relationship between the wavelengths is:
$\lambda_1 < \lambda_3 < \lambda_2$
Answer: $\lambda_1 < \lambda_3 < \lambda_2$
Hence, the correct answer is option: 'D'.