Q4 / 80 · NEST (NISER) 2025 · Biology
The oxygen dissociation curve (as percentage saturation versus $p O_2$ of blood) of haemoglobin for a healthy adult individual is shown in the graph.
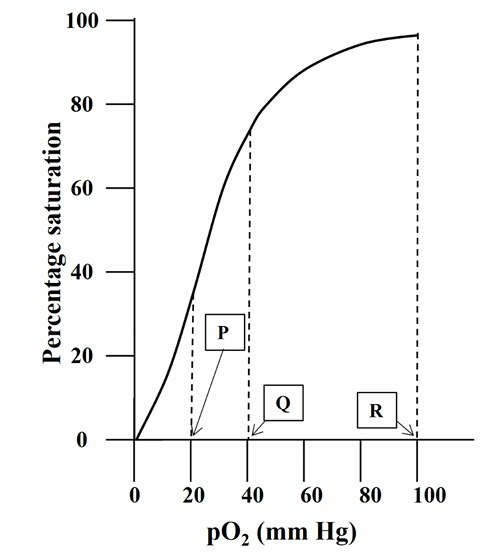
$\mathbf{P}, \mathbf{Q}$ and $\mathbf{R}$ in the graph, respectively, represent $\mathrm{pO}_2$ of blood in:
$\mathbf{P}, \mathbf{Q}$ and $\mathbf{R}$ in the graph, respectively, represent $\mathrm{pO}_2$ of blood in:
- Correct answerAveins (post-exercise); veins (at rest); arteries
- Barteries; veins (at rest); veins (post-exercise)
- Carteries; veins (post-exercise); veins (at rest)
- Dveins (at rest); veins (post-exercise); arteries
Hence, the correct answer is option: 'A'.