Q8 / 160 · TS EAMCET 2021 (05 Aug Shift 2) · Chemistry
The figure represents vs relation for and gases under identical conditions. Which curve, shown in the figure, represents gas?
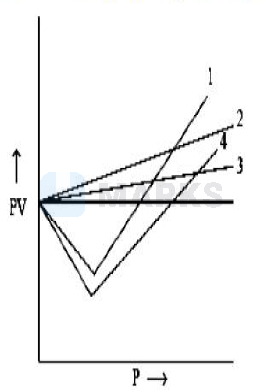
The figure represents vs relation for and gases under identical conditions. Which curve, shown in the figure, represents gas?
- A
- B
- Correct answerC
- D
Solution
To understand the deviations from ideal behaviour, let us first see how the real gases show deviations from Boyle’s law. According to Boyle’s law, PV = constant, at constant temperature. Hence, at constant temperature, plot of PV vs. P has to be a straight line which is parallel to x-axis. However, the real gases do not show such a behaviour as shown in figure no. Below.
From the plots, we observe that for gases like and He, PV increases continuously with increase of pressure whereas for gases like CO, etc. PV first decreases with increase of pressure and reaches a minimum value and then increases continuously with increase of pressure. Similarly, if we plot experimental values of pressure versus volume at constant temperature (that is, for real gas) and theoretically calculated values from Boyle’s law (that is, for ideal gas) the two curves do not coincide as shown in figure no. .
Hence, the correct answer is option: 'C'.