Q140 / 180 · COMEDK 2025 (10 May Shift 2) · Physics
The electric field versus distance graph is shown as given. Select the correct statement from the following.
E- electric field
R-radius
r - distance from the centre
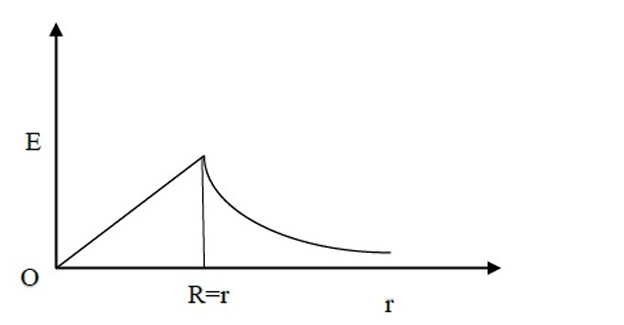
- AThe graph shows the variation of the electric field intensity with distance from the centre of a uniformly charged conducting ring of radius $R$.
- BThe graph shows the variation of the electric field intensity with distance from the centre of a uniformly charged non conducting cylinder of radius $R$.
- Correct answerCThe graph shows the variation of the electric field intensity with distance from the centre of a uniformly charged non conducting solid sphere of radius $R$.
- DThe graph shows the variation of the electric field intensity with distance from the centre of a uniformly charged conducting solid sphere of radius $R$.
Solution
The electric field $E$ inside a uniformly charged non-conducting solid sphere of radius $R$ at a distance $r$ from the center is given by $E = \dfrac{kQr}{R^3}$, which implies $E \propto r$. This corresponds to the linear increase in the graph for $r < R$.
Outside the sphere, for $r > R$, the electric field is given by $E = \dfrac{kQ}{r^2}$, which implies $E \propto \dfrac{1}{r^2}$. This corresponds to the curve decreasing as $r$ increases for $r > R$.
The graph shows a linear increase up to $r = R$ and a non-linear decrease for $r > R$, which is the characteristic behavior of the electric field of a uniformly charged non-conducting solid sphere.
Answer: The graph shows the variation of the electric field intensity with distance from the centre of a uniformly charged non conducting solid sphere of radius $R$.
Hence, the correct answer is option: 'C'.