Q193 / 200 · MHT CET - Medical 2026 (21 April Shift 2) · Physics
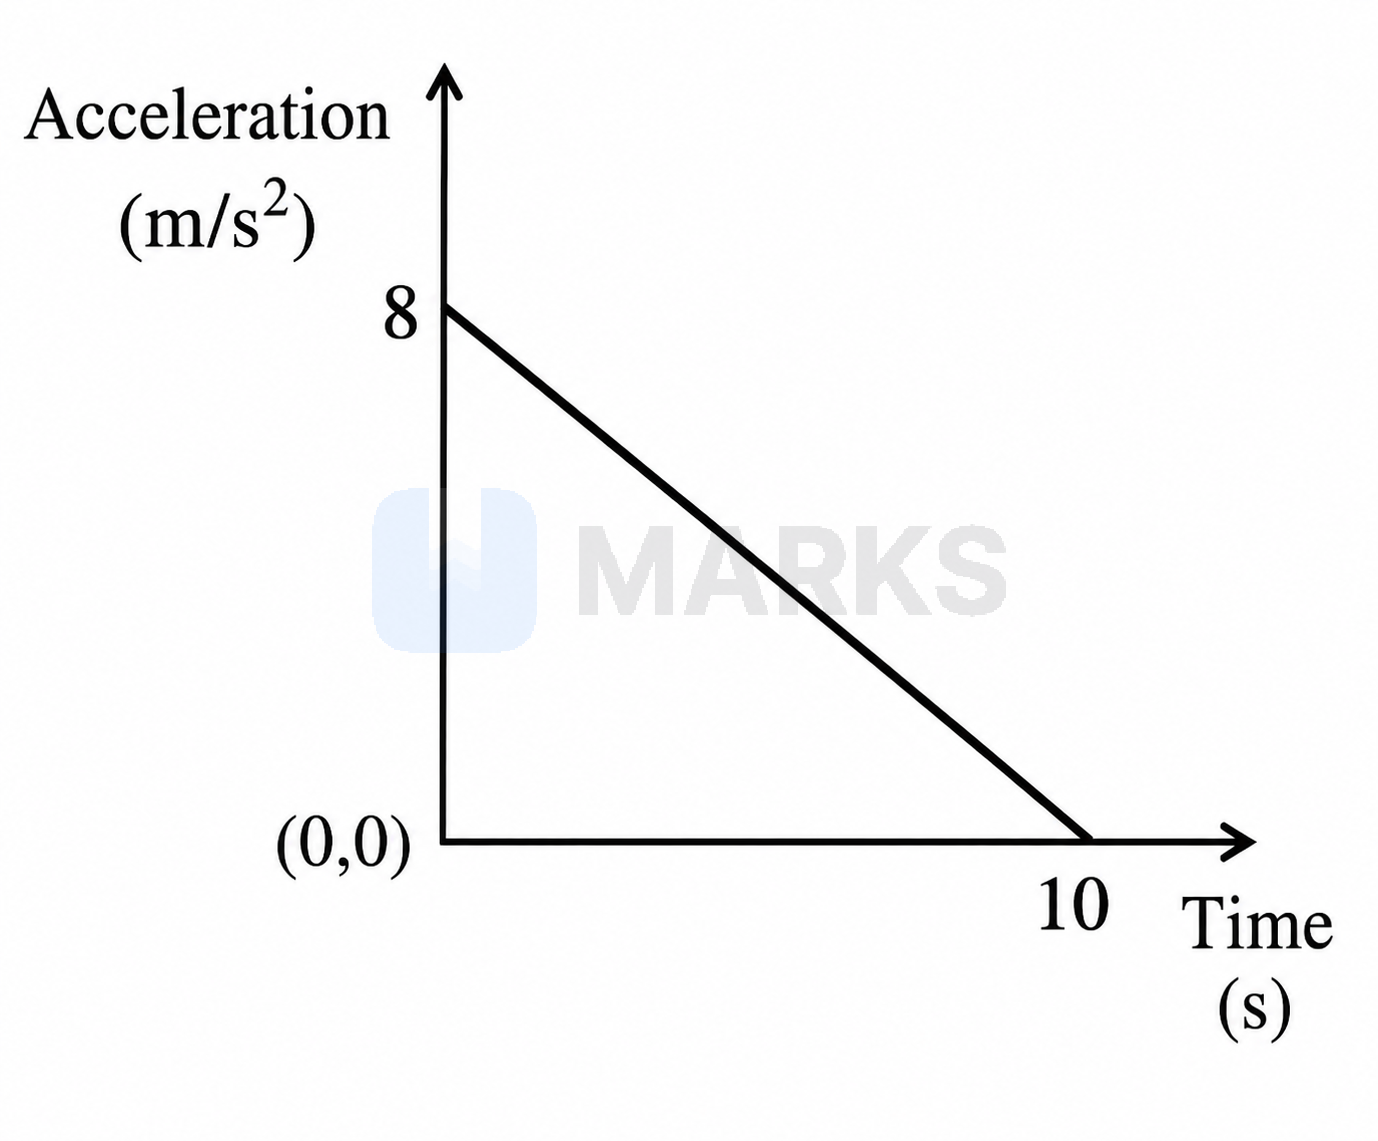
The acceleration ($a$) -time ($t$) graph for the body starting from rest is as shown in the figure. The maximum speed of the body is
- A$200\ \text{m/s}$
- B$160\ \text{m/s}$
- C$80\ \text{m/s}$
- Correct answerD$40\ \text{m/s}$
Solution
The change in velocity of a particle is equal to the area under its acceleration-time graph.
Since the body starts from rest, its initial velocity $u = 0$. The acceleration is positive from $t = 0$ to $t = 10\ \text{s}$, which means the velocity continuously increases and reaches its maximum at $t = 10\ \text{s}$.
$v_{\text{max}} - u = \text{Area of the triangle}$
$v_{\text{max}} - 0 = \dfrac{1}{2} \times \text{base} \times \text{height}$
$v_{\text{max}} = \dfrac{1}{2} \times 10 \times 8 = 40\ \text{m/s}$
Answer: $40\ \text{m/s}$
Hence, the correct answer is option: 'D'.