Q116 / 200 · NEET 2012 (Screening) · Physics
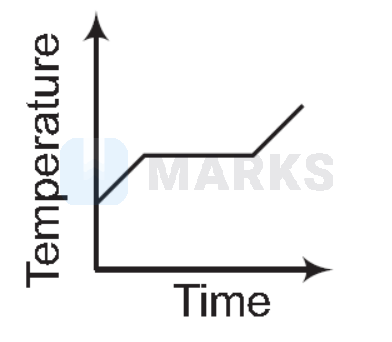
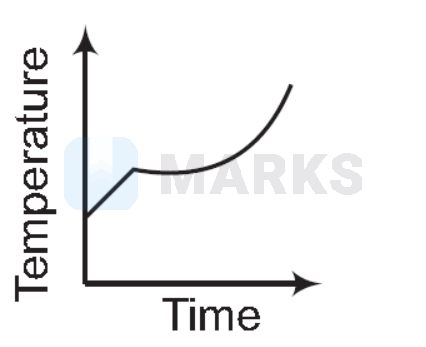
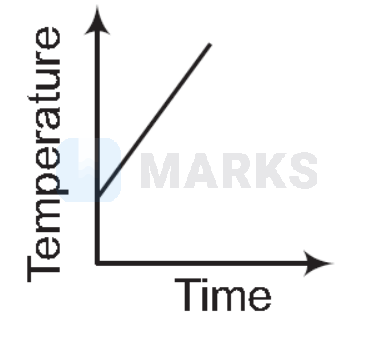
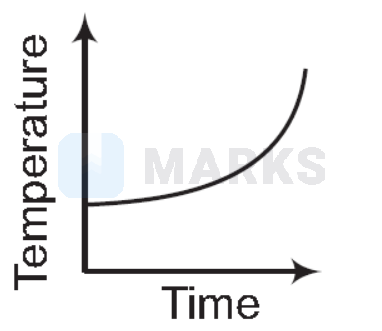
Liquid oxygen at $50 \mathrm{~K}$ is heated to $300 \mathrm{~K}$ at constant pressure of 1 atm. The rate of heating is constant. Which one of the following graphs represents the variation of temperature with time?
- Correct answerA
- B
- C
- D
Solution
Graph (a) shows the variation of temperature with time. At first temperature will increase then there will be state change from liquid to gas.
Hence, the correct answer is option: 'A'.