Q74 / 200 · MHT CET - Medical 2026 (26 April Shift 1) · Biology
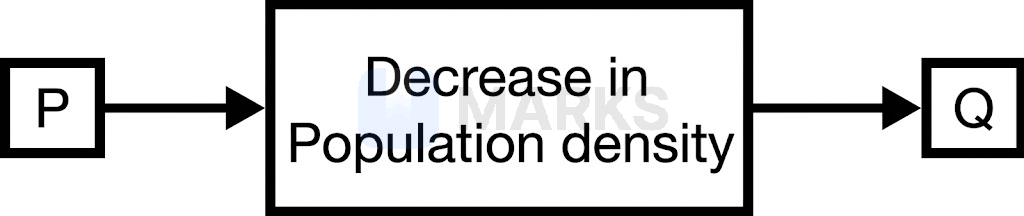
Identify the correct equation with respect to diagram below, which depicts decrease in population density.
- Correct answerA$P > Q$
- B$P < Q$
- C$P = Q$
- D$P \propto Q$
Solution
Based on the given flow diagram, $P$ represents the initial state of the population density and $Q$ represents the final state after a certain process has occurred.
The process indicated in the box is a "Decrease in Population density".
For a population density to decrease over a period of time, the initial population density ($P$) must be greater than the final population density ($Q$).
Therefore, the correct mathematical relationship is $P > Q$.
Answer: $P > Q$
Hence, the correct answer is option: 'A'.