Q181 / 200 · MHT CET - Medical 2026 (23 April Shift 2) · Physics
Consider a thin spherical shell of radius R with its centre at the origin, carrying uniform positive surface charge density. The variation of the magnitude of the electric field $E(r)$ and electric potential $V(r)$ with the distance r from the centre, is best represented by which graph?
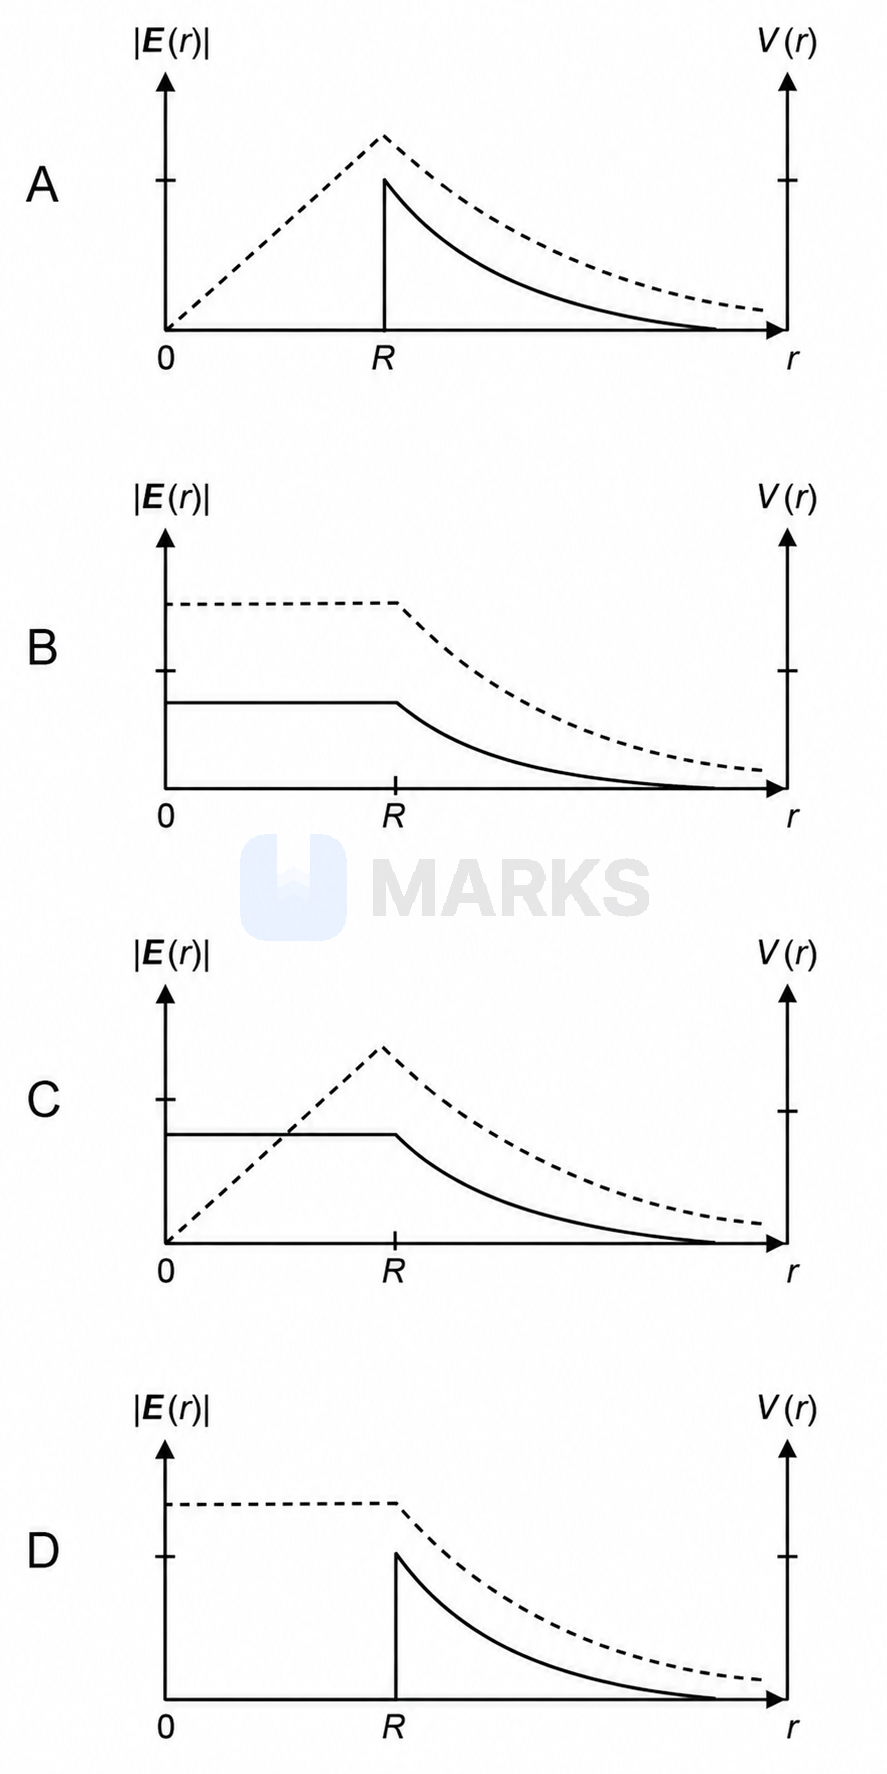
Continuous curve stands for intensity. Dotted curve stands for potential.
Continuous curve stands for intensity. Dotted curve stands for potential.
- AC
- BA
- Correct answerCD
- DB
Solution
For a thin spherical shell of radius $R$ with a uniform positive surface charge density, the electric field $E(r)$ and electric potential $V(r)$ are given by:
1. Electric Field ($E$):
Inside the shell ($r < R$), the electric field is zero because the charge enclosed by any Gaussian surface inside the shell is zero.
$E(r) = 0$ for $r < R$
Outside the shell ($r \ge R$), the shell behaves as a point charge located at its centre.
$E(r) = \dfrac{1}{4\pi\epsilon_0} \dfrac{Q}{r^2}$ for $r \ge R$
Thus, the continuous curve representing $|E(r)|$ should be zero for $r < R$, jump to a maximum at $r = R$, and then decrease as $\dfrac{1}{r^2}$.
2. Electric Potential ($V$):
Inside the shell ($r \le R$), the electric field is zero, so the potential is constant and equal to the potential at the surface.
$V(r) = \dfrac{1}{4\pi\epsilon_0} \dfrac{Q}{R}$ for $r \le R$
Outside the shell ($r > R$), the potential decreases inversely with distance.
$V(r) = \dfrac{1}{4\pi\epsilon_0} \dfrac{Q}{r}$ for $r > R$
Thus, the dotted curve representing $V(r)$ should be a horizontal line (constant) for $r \le R$ and then decrease as $\dfrac{1}{r}$.
Graph D is the only one that correctly shows the continuous curve as zero for $r < R$ and the dotted curve as constant for $r \le R$.
Answer: D
Hence, the correct answer is option: 'C'.