Q31 / 268 · NTA Abhyas (NEET) 2020 · Physics · Thermodynamics
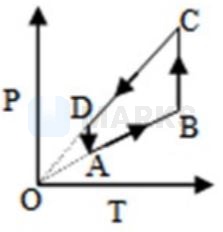
A cyclic process is shown on the diagram. The same process on a diagram is shown by
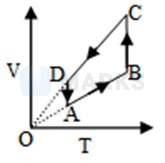
- Correct answerA
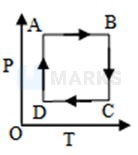
- B
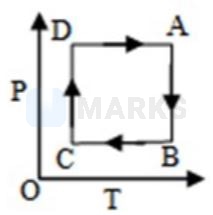
- C
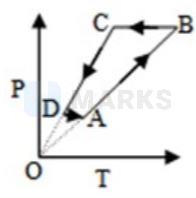
- D
Solution
Isobaric expansion
Isothermal expansion
Isobaric compression
Isothermal compression
So, when the graph is plotted between &
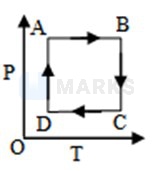
Isothermal expansion
Isobaric compression
Isothermal compression
So, when the graph is plotted between &
Hence, the correct answer is option: 'A'.