Q111 / 150 · MHT CET 2026 (13 April Shift 1) · Physics
Which one of the four graphs showing lines P, Q, R and S between maximum kinetic energy (E) and intensity of incident radiation (I) is correct?
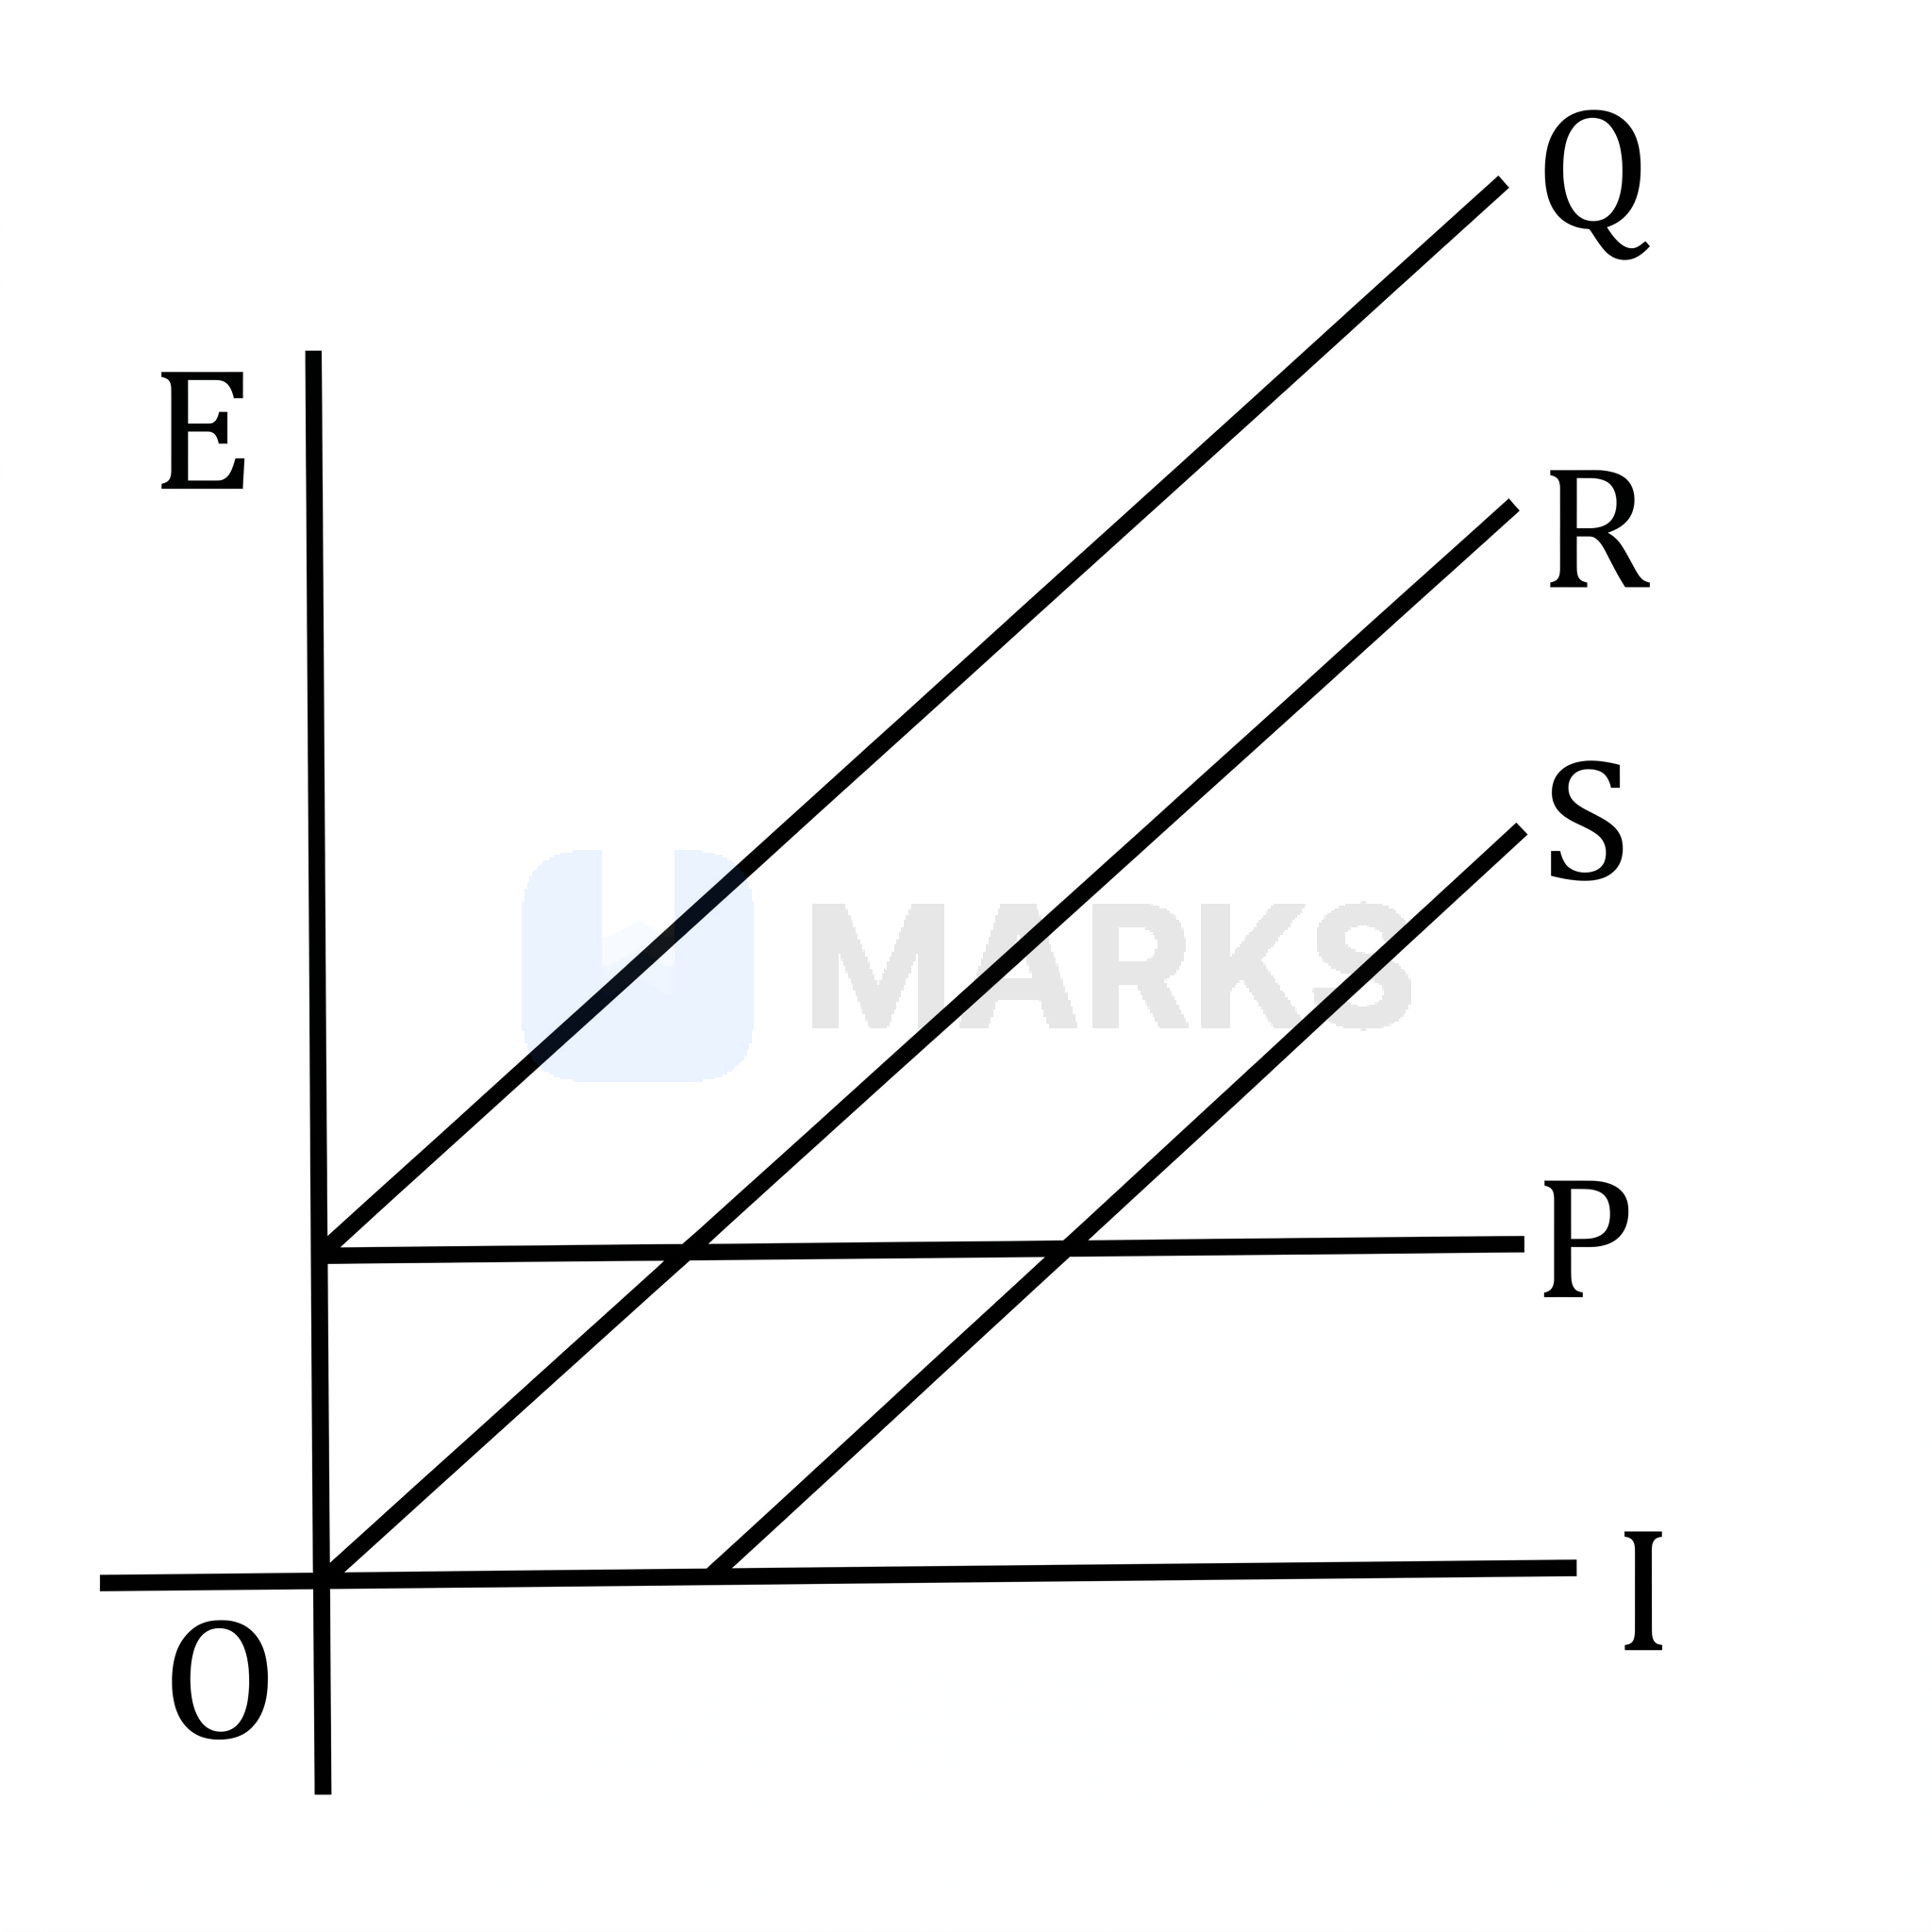
- Correct answerAP
- BQ
- CR
- DS
Solution
According to Einstein's photoelectric equation, the maximum kinetic energy of emitted photoelectrons is given by:
$E = h\nu - \Phi$
where $h$ is Planck's constant, $\nu$ is the frequency of incident radiation, and $\Phi$ is the work function of the material.
From this equation, it is clear that the maximum kinetic energy ($E$) depends only on the frequency of the incident radiation and the nature of the material. It is completely independent of the intensity ($I$) of the incident radiation, provided the frequency is above the threshold frequency.
Therefore, the graph between maximum kinetic energy ($E$) and intensity ($I$) will be a straight horizontal line parallel to the intensity axis. Line P correctly represents this behavior.
Answer: P
Hence, the correct answer is option: 'A'.