Q3 / 160 · TS EAMCET 2003 · Chemistry
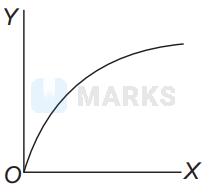
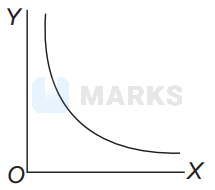
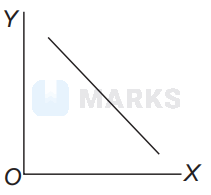
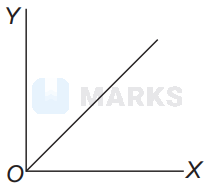
Which one of the following represents the graph between $\log p$ (on $Y$-axis) and $\frac{1}{T}$ (on $X$-axis)?
( $p=$ vapour pressure of a liquid, $T=$ absolute temperature)
- A
- B
- Correct answerC
- D
Solution
According to Clausis and Clapeyron, if a graph is plotted between $\log p$ and $\frac{1}{T^{\prime}}$ a straight line is obtained with - ve slope.
Hence, the correct answer is option: 'C'.