Q29 / 60 · IAT (IISER) 2024 · Chemistry
Which one of the following plots correctly describes the variation of osmotic pressure ( $\Pi$ ) of a fixed amount of a solute against the volume (V) of the solution at a fixed temperature?
- A

- B
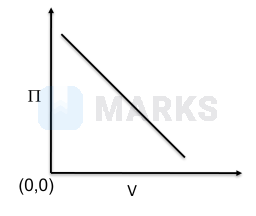
- C

- Correct answerD
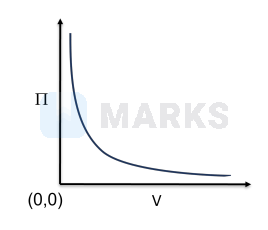
Hence, the correct answer is option: 'D'.