Q78 / 100 · BITSAT 2022 · Physics
Which one of the following graphs represents the variation of electric potential with distance $r$ from the centre of a non-conducting charged sphere of radius $R$ ?
- A
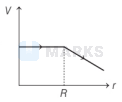
- B
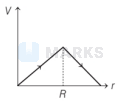
- C
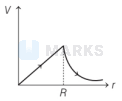
- Correct answerD
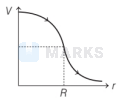
Solution
Electric potential at centre $R=0$
$$
V_{\text {centre }}=1.5 V_{\text {surface }}
$$
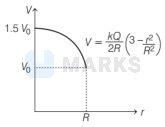
where, $$ \begin{aligned} V_0 & =\frac{k Q}{R} \\ V_{\text {inside }} & =\frac{k Q}{2 R}\left(3-\frac{r^2}{R^2}\right) \end{aligned} $$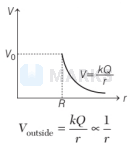
where, $$ \begin{aligned} V_0 & =\frac{k Q}{R} \\ V_{\text {inside }} & =\frac{k Q}{2 R}\left(3-\frac{r^2}{R^2}\right) \end{aligned} $$
Hence, the correct answer is option: 'D'.