Q18 / 160 · TS EAMCET 2008 · Chemistry
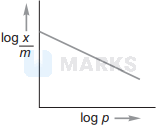
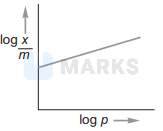
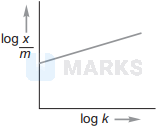
Which one of the following graphs represents Freundlich adsorption isotherm?
- A

- B
- Correct answerC
- D
Solution
When we plot a graph between $\log (x / m)$ and $\log p$, a straight line with positive slope will be obtained. This graph represents the Freundlich adsorption isotherm.
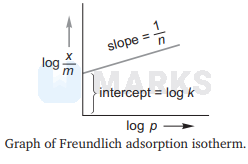
Hence, the correct answer is option: 'C'.