Q65 / 240 · KCET 2026 · Chemistry
Which one of the following graph is not applicable for a 1st order reaction ($R \rightarrow P$)?
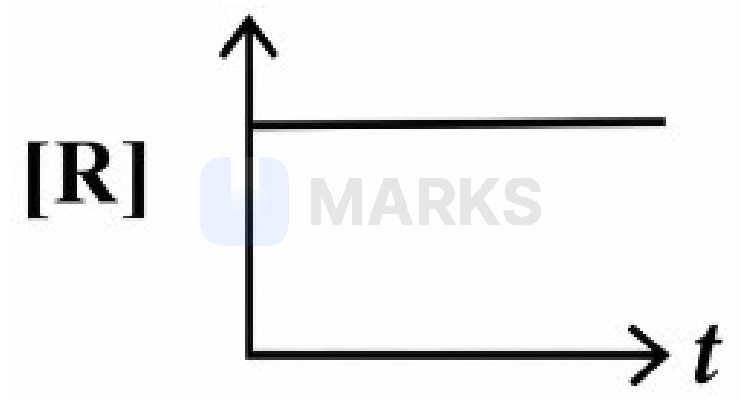
- Correct answerA
- B
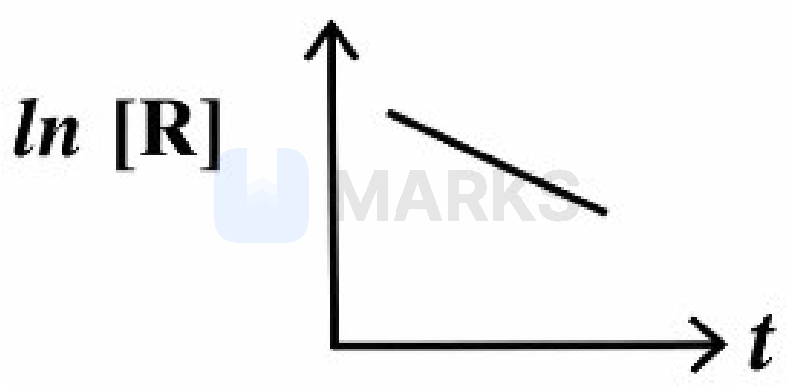
- C
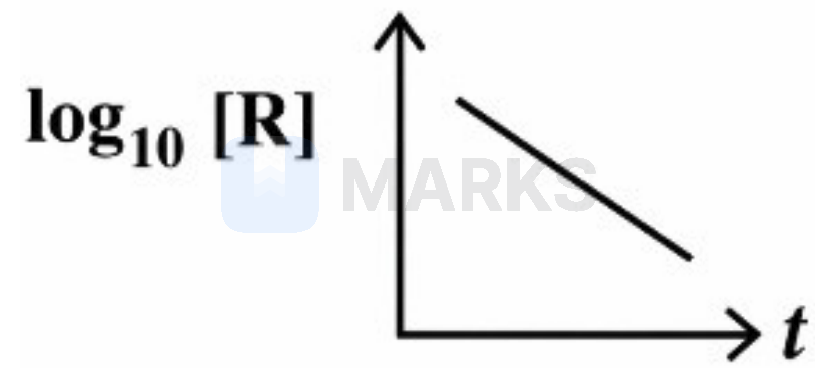
- D
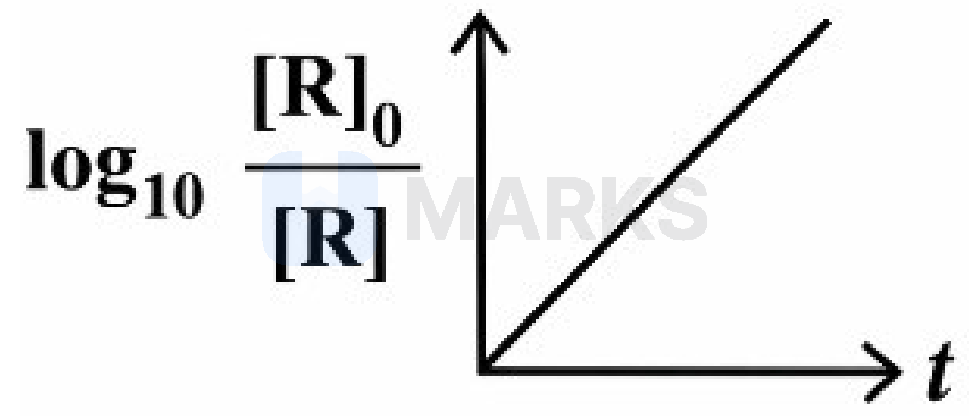
Solution
For a first-order reaction $R \rightarrow P$, the integrated rate law is given by:
$[R] = [R]_0 e^{-kt}$
This indicates that the concentration of the reactant $[R]$ decreases exponentially with time $t$. Therefore, the graph of $[R]$ versus $t$ should be an exponentially decaying curve. Graph (A) shows $[R]$ as a constant horizontal line, which is incorrect for a first-order reaction.
Taking the natural logarithm on both sides of the rate law:
$\ln [R] = \ln [R]_0 - kt$
This is a linear equation ($y = mx + c$) with a negative slope ($-k$). Graph (B) correctly represents this.
Converting to base-10 logarithm:
$\log_{10} [R] = \log_{10} [R]_0 - \dfrac{k}{2.303} t$
This is also a straight line with a negative slope ($-\dfrac{k}{2.303}$). Graph (C) correctly represents this.
Rearranging the above equation:
$\log_{10} \dfrac{[R]_0}{[R]} = \dfrac{k}{2.303} t$
This represents a straight line passing through the origin with a positive slope ($\dfrac{k}{2.303}$). Graph (D) correctly represents this.
Thus, the graph in option (A) is not applicable for a first-order reaction.
Answer:
Hence, the correct answer is option: 'A'.