Q60 / 200 · NEET 2022 (Phase 1) · Chemistry
Which of the following curve represents maximum work done?
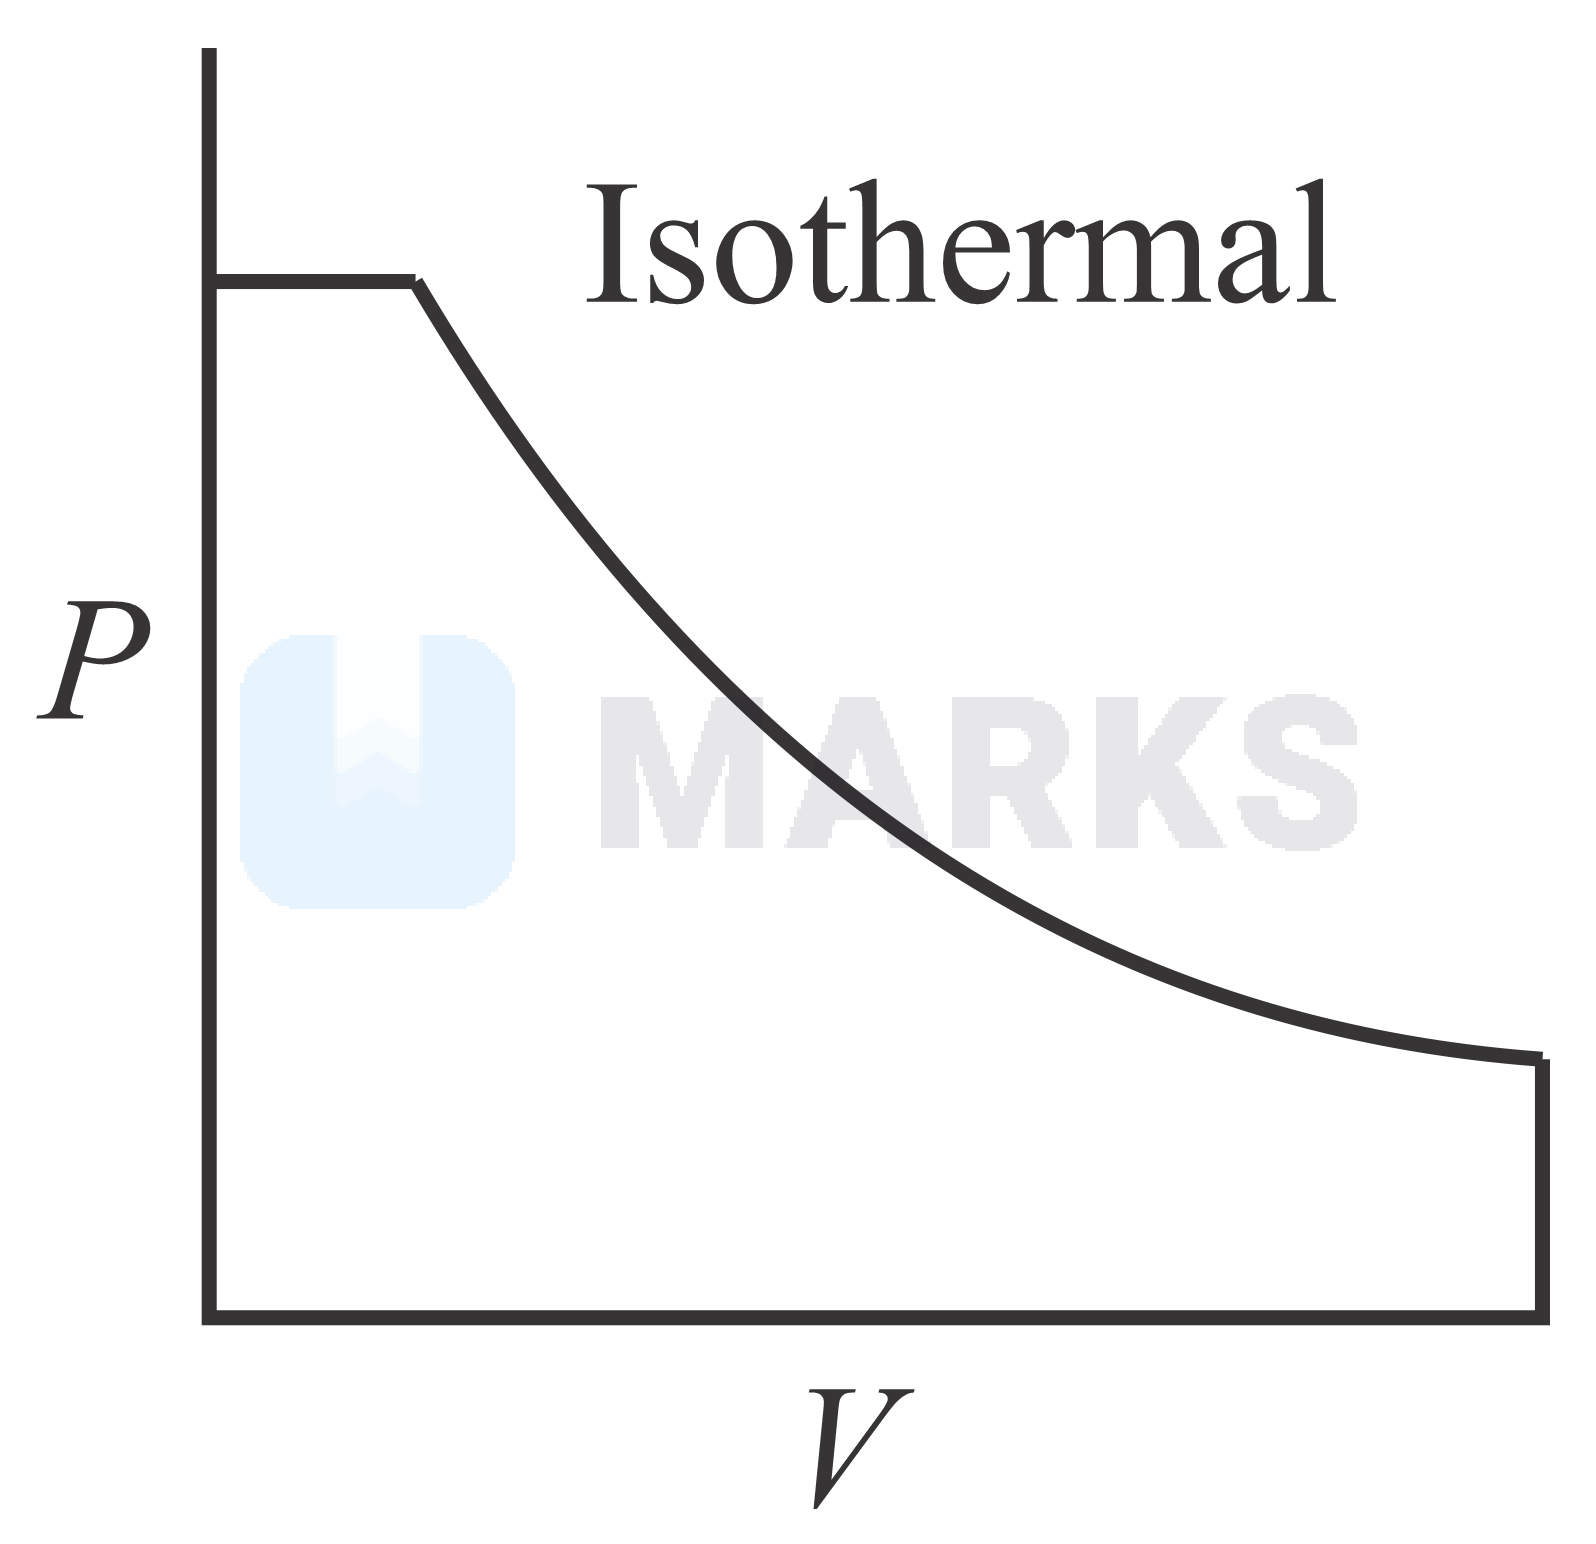
- Correct answerA
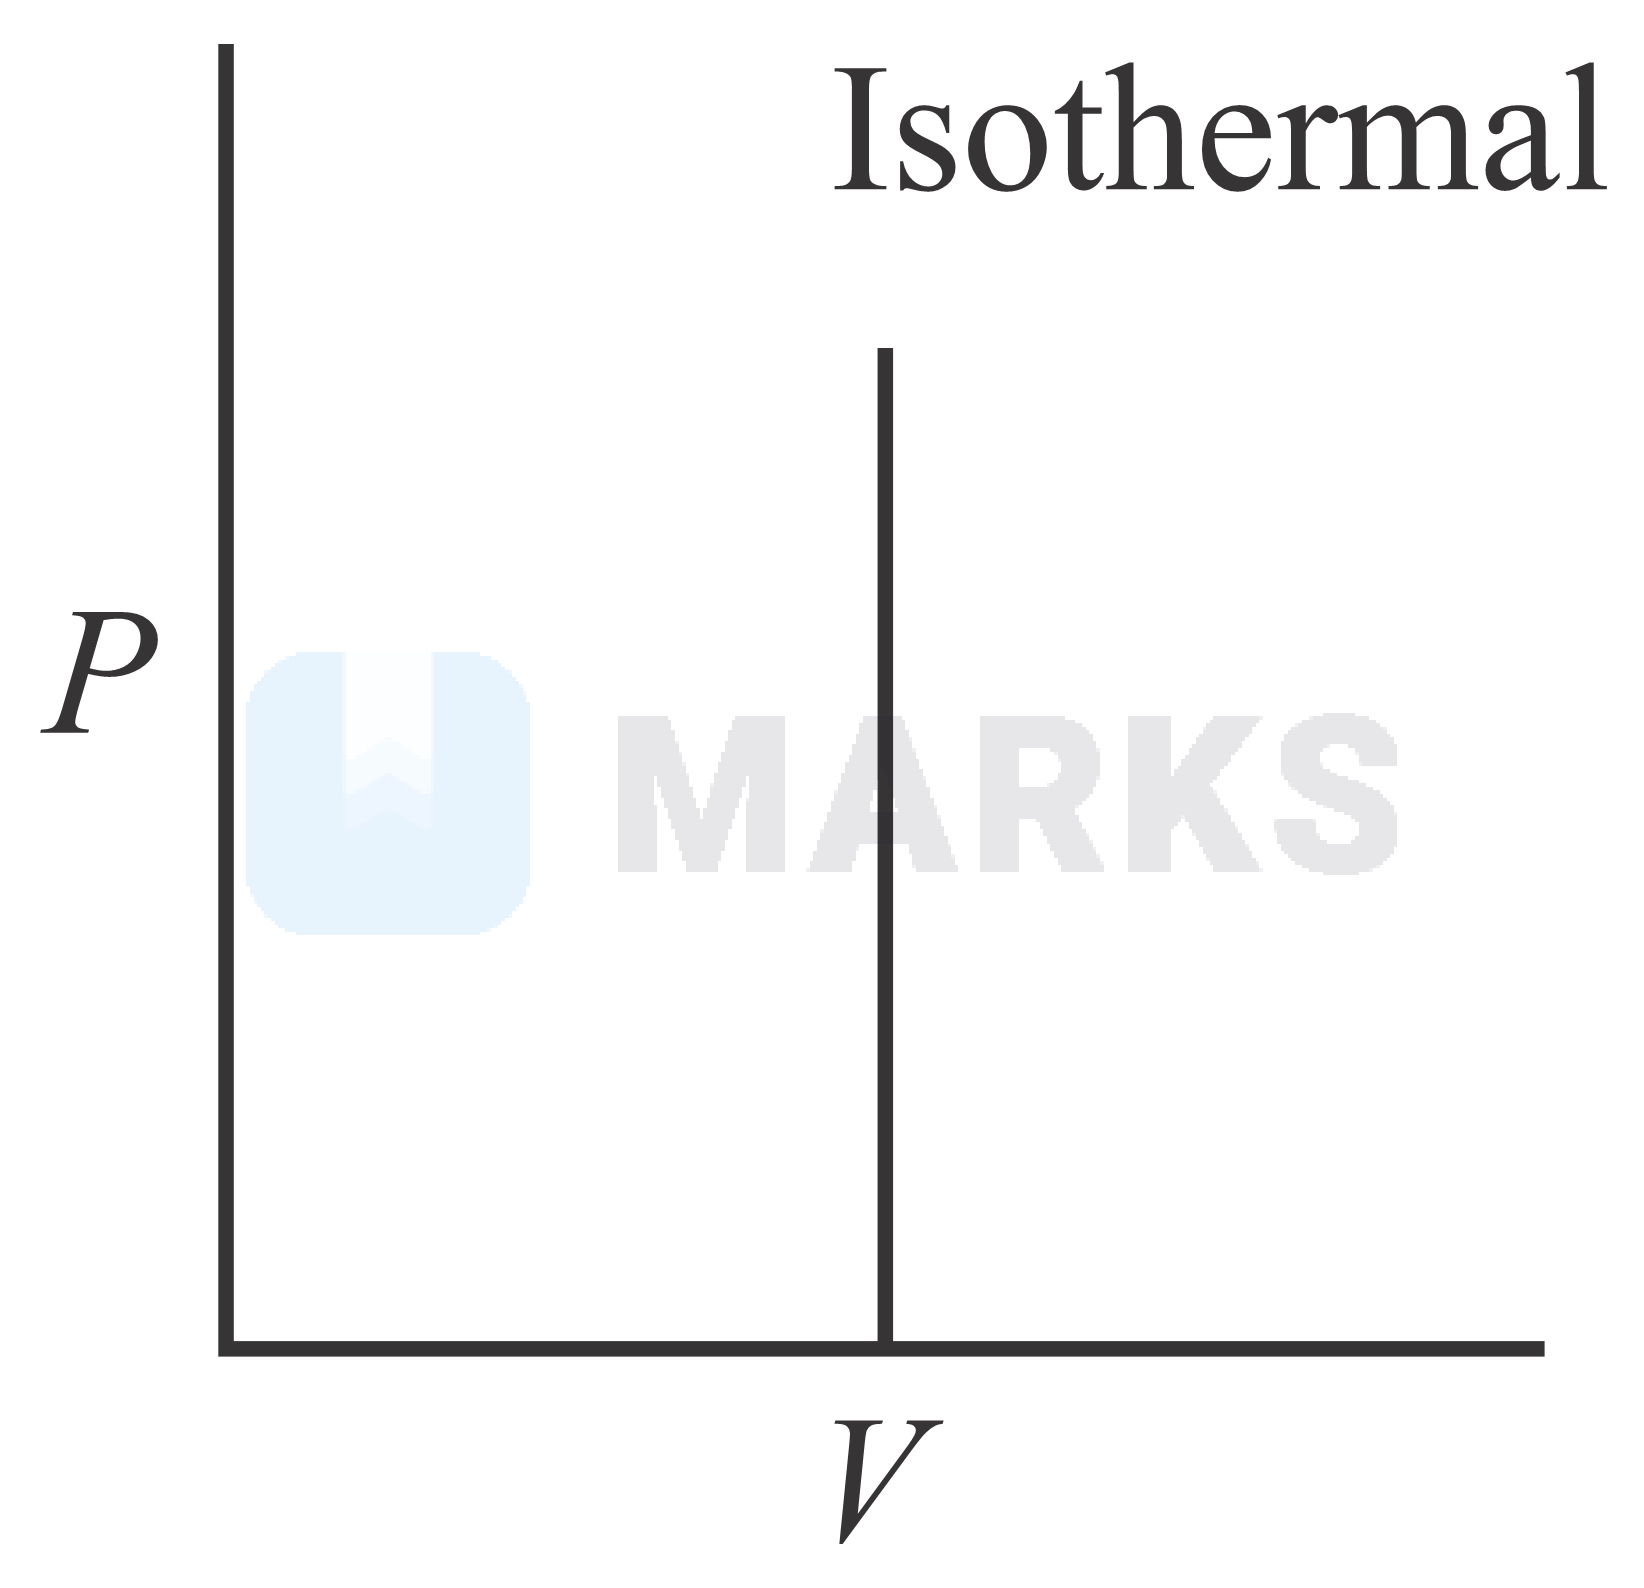
- B
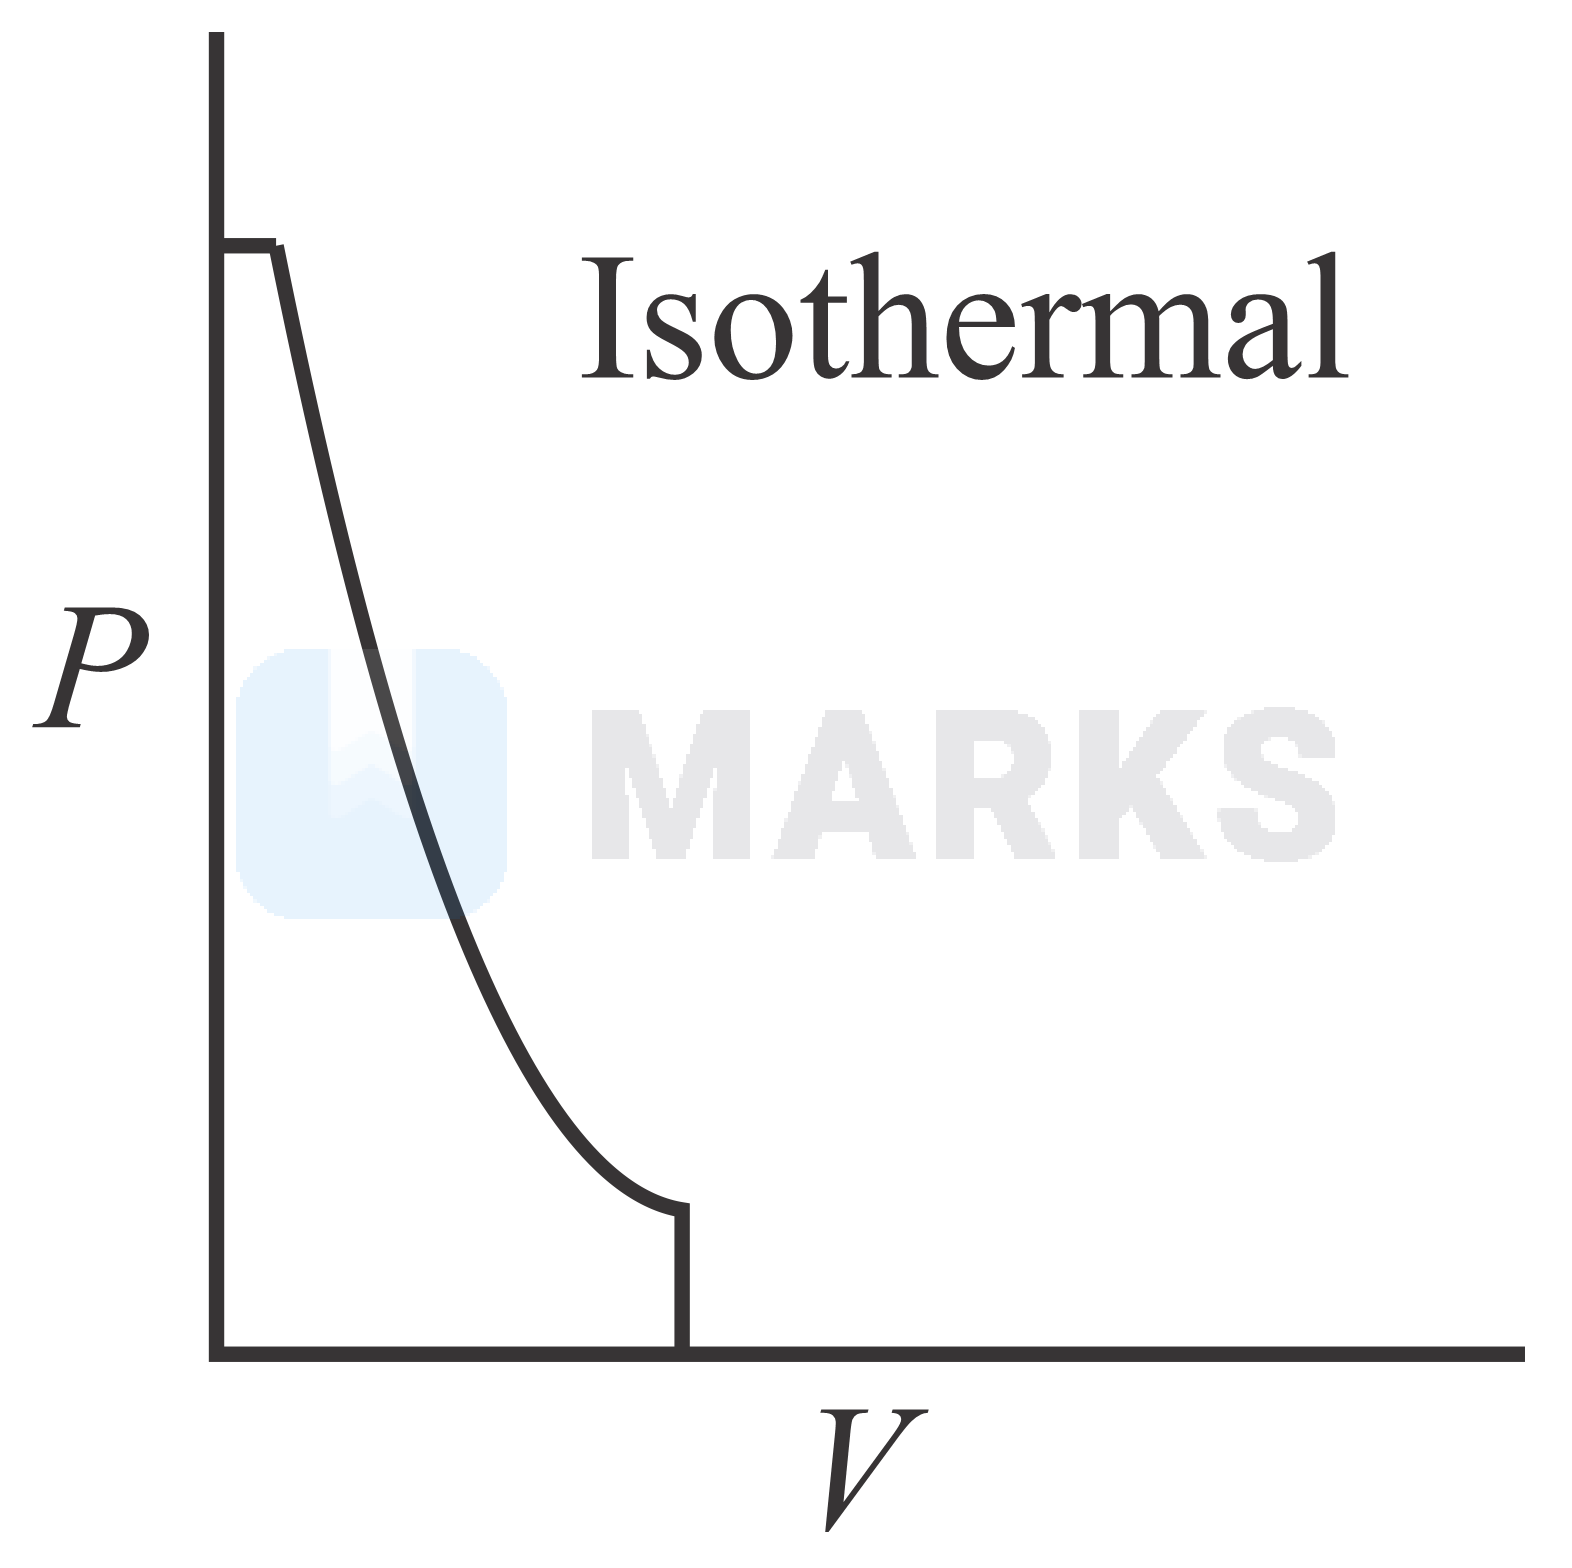
- C
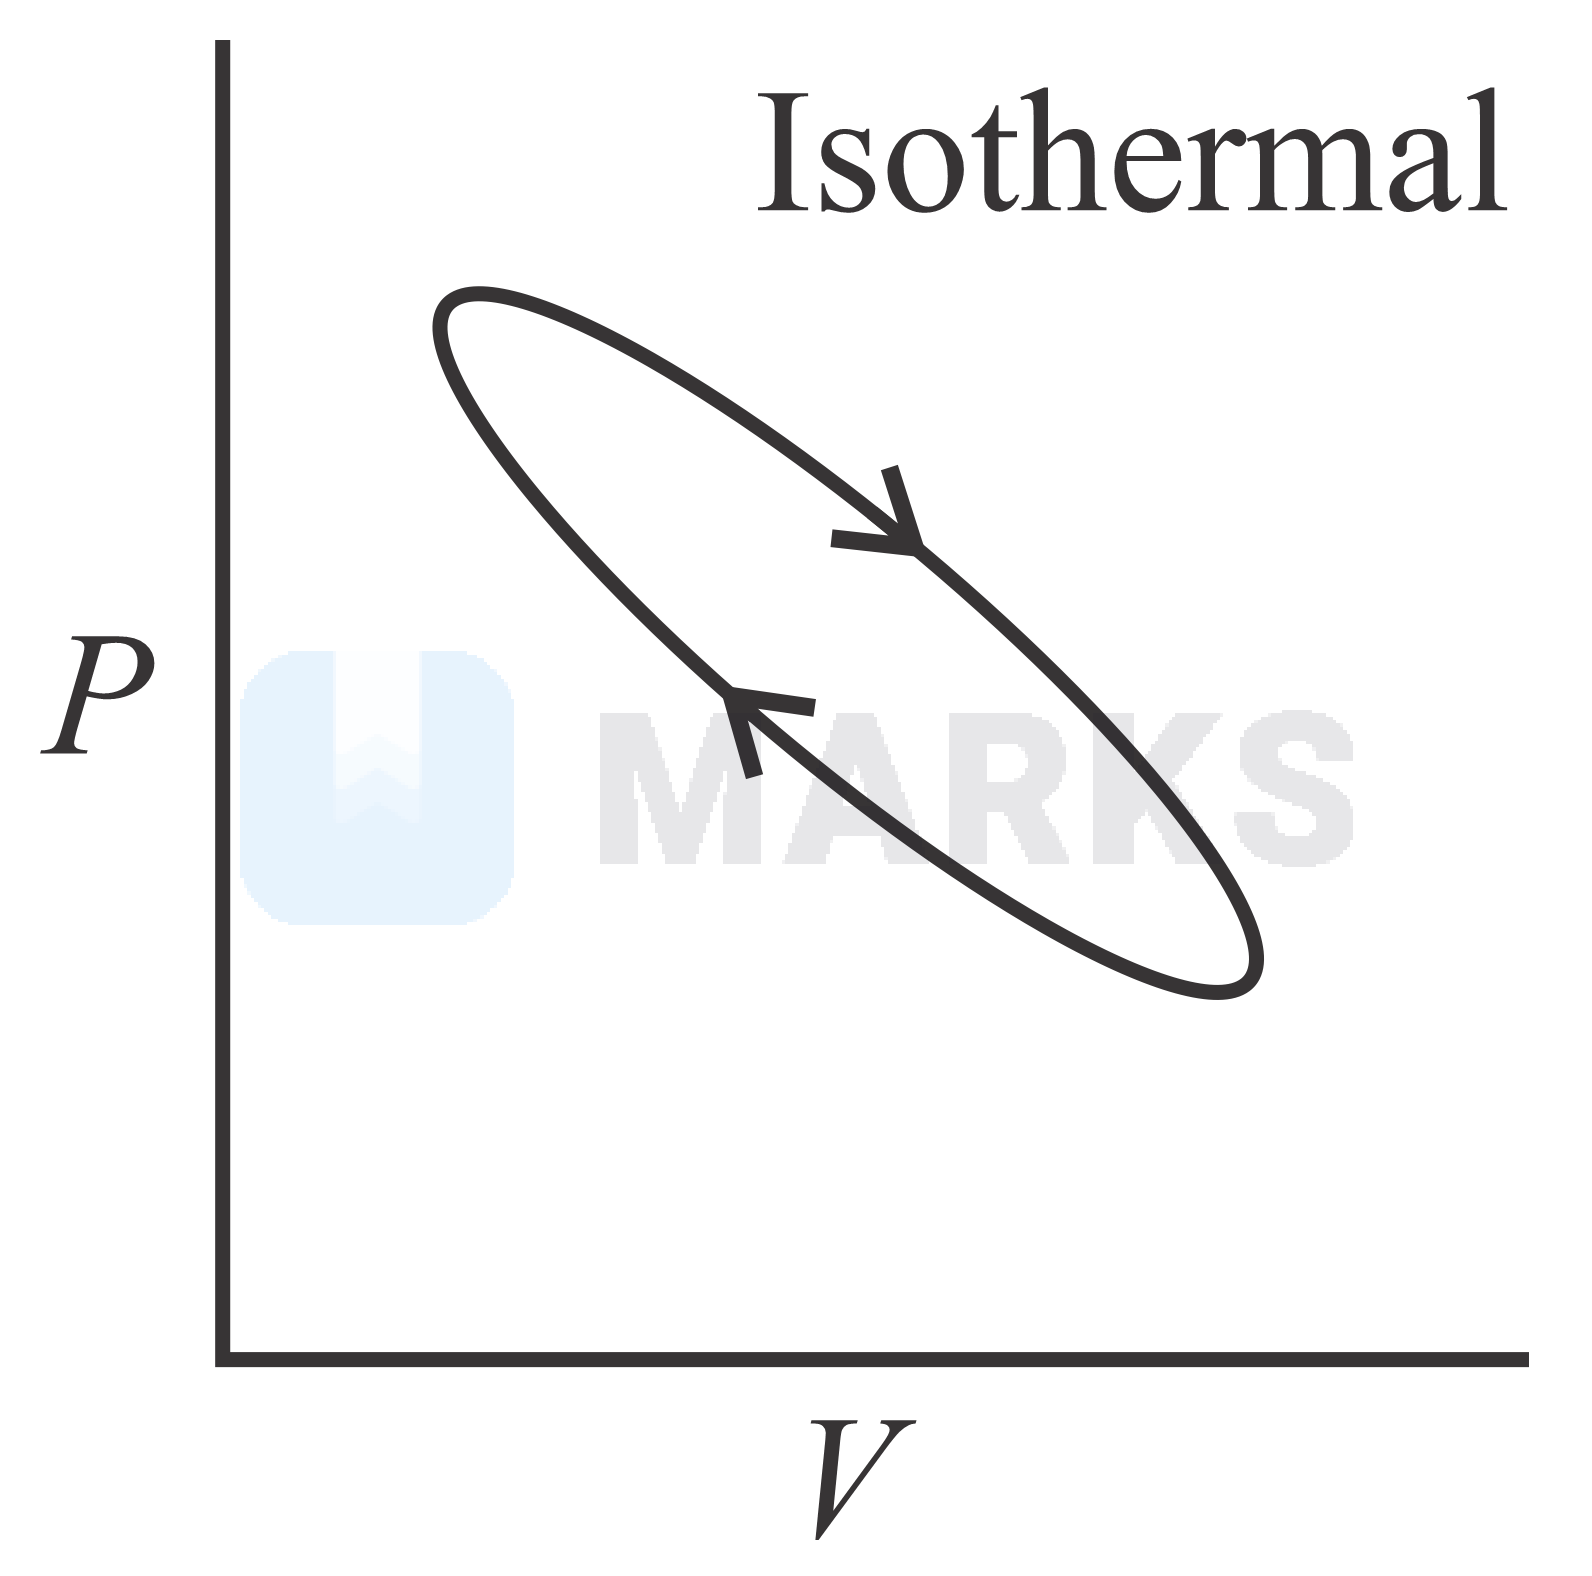
- D
Solution
The area under the curve represents the work done. Work can be calculated by calculating area between P-V graph and volume axis. Among the given graphs, the area under the curve is maximum for graph A.
Option B represent isochoric process so, work done will be zero.
Option C and option D has less area under the curve.
Hence, the correct answer is option: 'A'.