Q25 / 75 · JEE Main 2025 (2 Apr Shift 2) · Chemistry
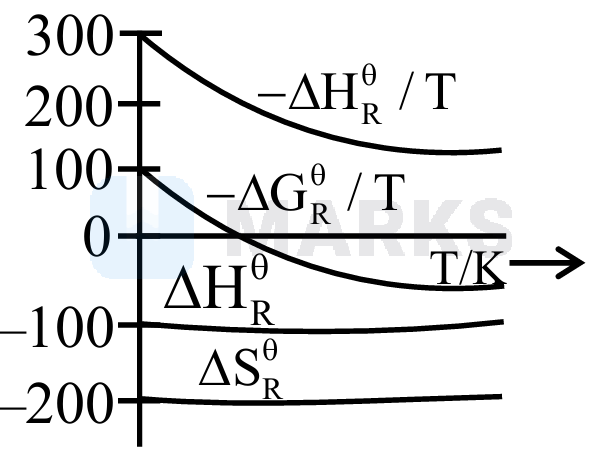
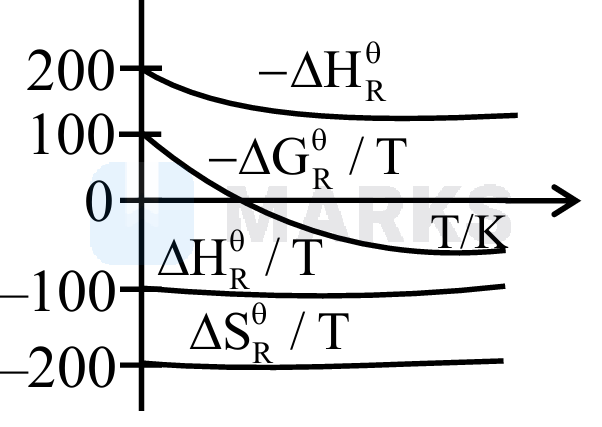
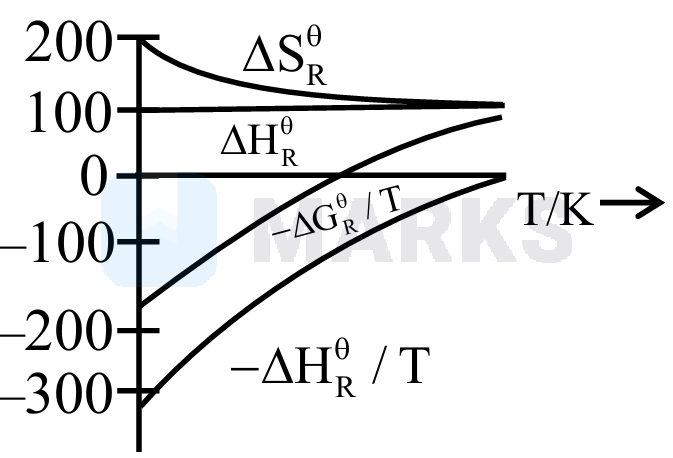
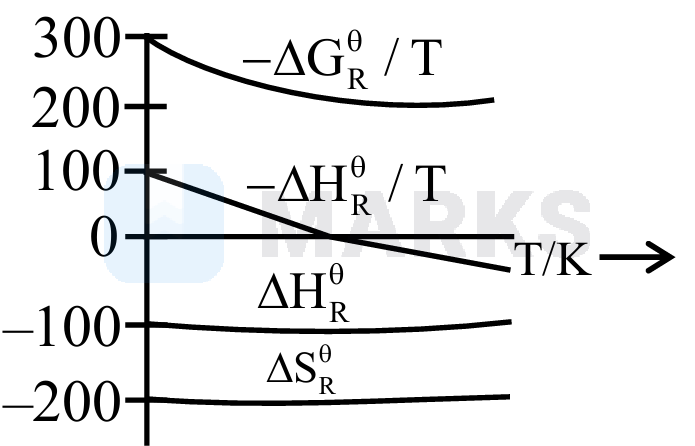
Which of the following graphs correctly represents the variation of thermodynamic properties of Haber's process?
- Correct answerA
- B
- C
- D
Solution
$\begin{aligned}<br />& \mathrm{N}_2(\mathrm{~g})+3 \mathrm{H}_2(\mathrm{~g}) \rightarrow 2 \mathrm{NH}_3 \\<br>& \Delta \mathrm{H}^{\circ}=-\mathrm{ve} \\<br>& \Delta \mathrm{~S}^{\circ}=-\mathrm{ve}<br />\end{aligned}$
(As gaseous moles decreases).
(1) As temperature increases $\frac{-\Delta \mathrm{H}_R^0}{T}$, decreases
(2) $\Delta \mathrm{G}^{\circ}=-\mathrm{RT} \ln \mathrm{K}_{\mathrm{eq}}$
$\mathrm{R} \ln \mathrm{K}_{\mathrm{eq}}=-\frac{\Delta \mathrm{G}^0}{\mathrm{~T}}$
(on increasing temperature in exothermic reaction $\mathrm{K}_{\text {eq }}$ decreases)
$\Delta \mathrm{H}^{\circ}$ and $\Delta \mathrm{S}^{\circ}$ are almost constant with temperature.
Hence, the correct answer is option: 'A'.