Q7 / 60 · IAT (IISER) 2020 · Biology
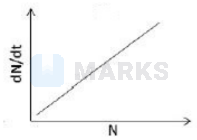
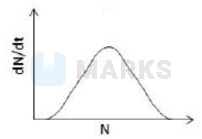
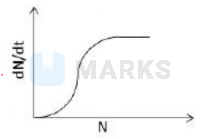
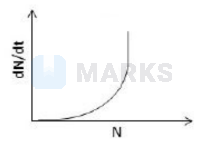
Which of the following graphs correctly represents the relationship between population growth rate $(\mathrm{dN} / \mathrm{dt})$ and population size $(\mathrm{N})$, if the population shows logistic growth?
- A
- Correct answerB
- C
- D
Hence, the correct answer is option: 'B'.