Q93 / 110 · VITEEE 2024 · Physics
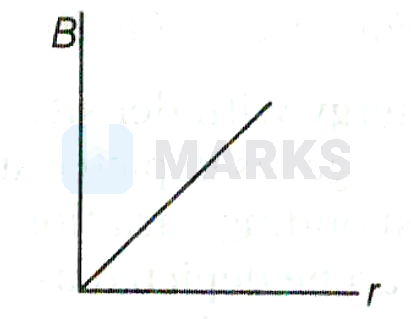
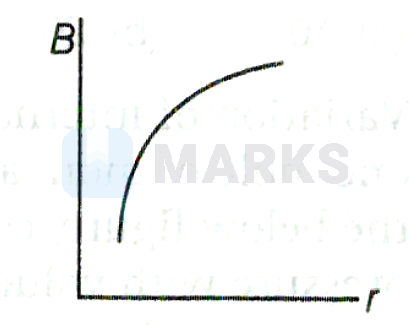
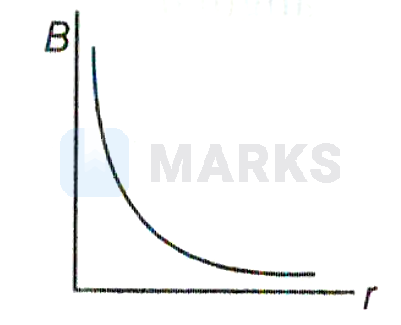
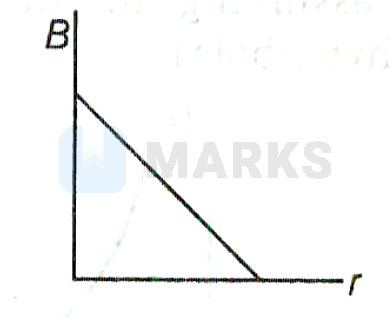
Which of the following graph represents the variation of magnetic flux density $B$ with distance $r$ for a straight long wire carrying an electric current?
- A
- B
- Correct answerC
- D
Solution
Magnetic field density $B$ due to long straight current carrying conductor at a distance $r$ is given as
$B=\frac{\mu_0}{2 \pi} \cdot \frac{i}{r}$
i.e.
$B \propto \frac{1}{r}$
Hence, option (3) is correct.
Hence, the correct answer is option: 'C'.