Q116 / 150 · MHT CET 2025 (21 Apr Shift 1) · Physics
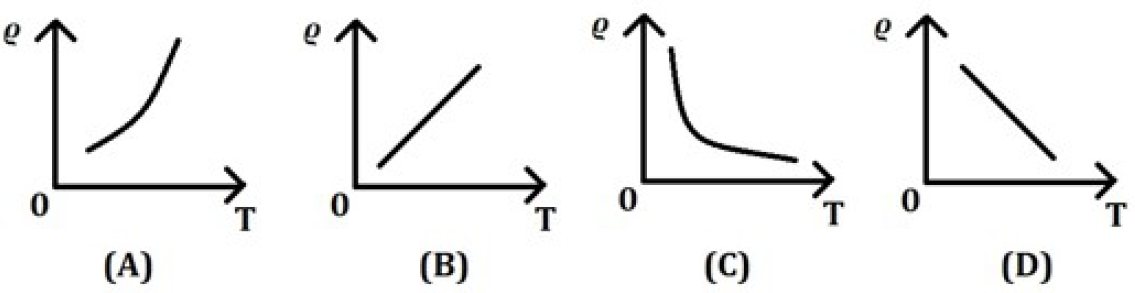
Which graph shows correctly the temperature (T) dependence of resistivity ($\varrho$) of a semiconductor?
- Correct answerAC
- BA
- CD
- DB
Solution
The resistivity of a semiconductor varies with temperature according to the relation $\rho = \rho_0 e^{E_g / (2k_B T)}$, where $\rho_0$ is a constant, $E_g$ is the band gap energy, $k_B$ is Boltzmann’s constant, and $T$ is the absolute temperature.
As $T$ increases, the exponential term $e^{E_g / (2k_B T)}$ decreases, leading to a reduction in $\rho$. This follows from increased thermal excitation of charge carriers across the band gap, enhancing conductivity. Since resistivity is the reciprocal of conductivity, it declines with rising temperature.
Graph (C) exhibits a non-linear decrease in $\rho$ with increasing $T$, consistent with the exponential decay in the model. In contrast, (A) and (B) show resistivity increasing with temperature—behavior typical of metals—while (D) displays a linear decrease, inconsistent with semiconductor physics.
The correct representation is therefore graph (C).
Hence, the correct answer is option: 'A'.