Q67 / 90 · JEE Main 2023 (13 Apr Shift 1) · Physics
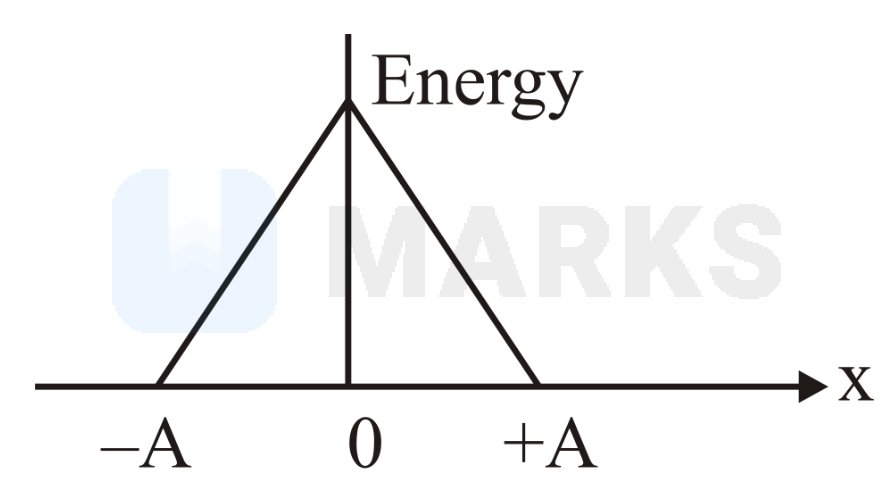
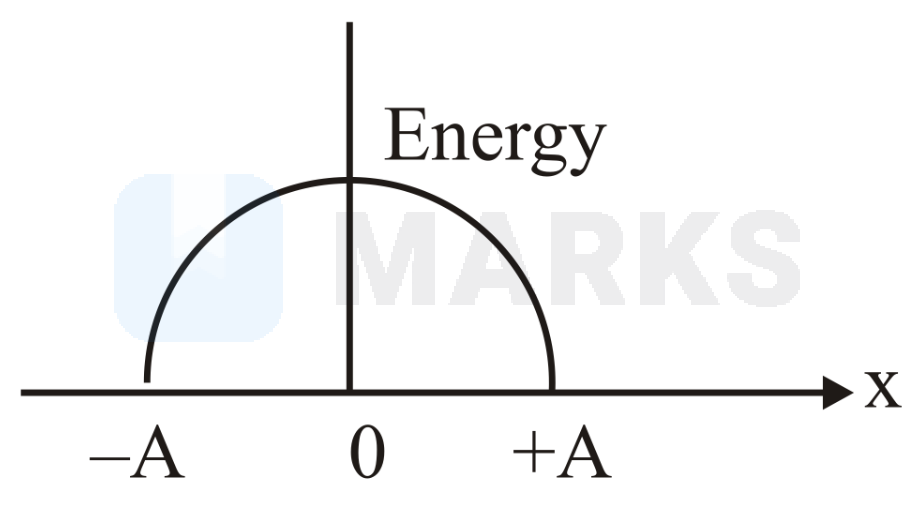
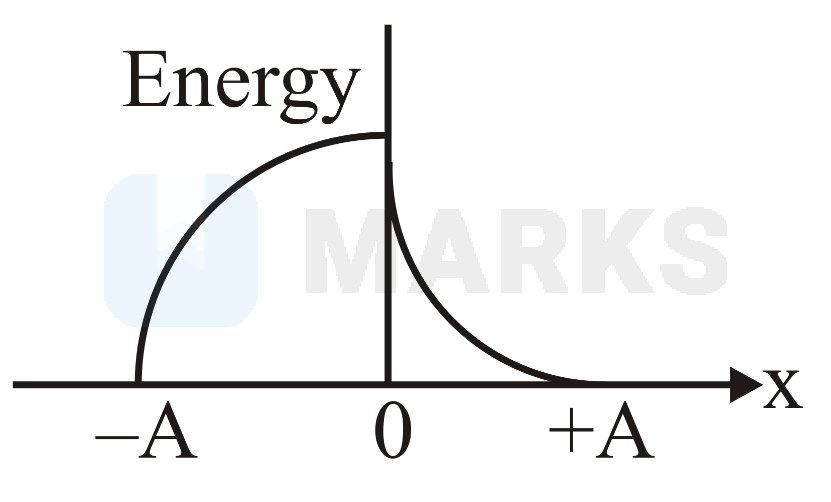
Which graph represents the difference between total energy and potential energy of a particle executing vs its distance from mean position?
Which graph represents the difference between total energy and potential energy of a particle executing vs its distance from mean position?
- A
- Correct answerB
- C

- D
Solution
In a SHM, mechanical energy is conserved. So, the sum of kinetic energy and potential energy remains constant.
For a SHM,
This is the equation of a downward parabola.
Hence, the correct answer is option: 'B'.