Q7 / 160 · TS EAMCET 2020 (11 Sep Shift 1) · Chemistry
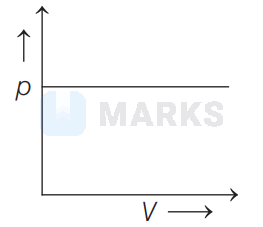
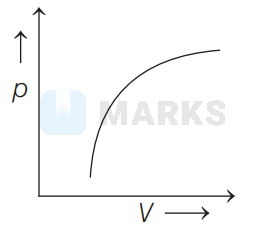
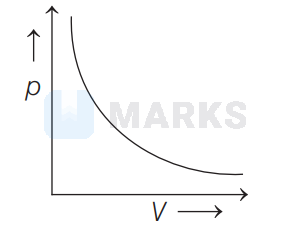
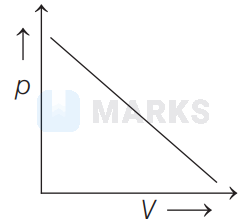
Which among the following graphs, correctly represents the Boyle's Law?
- A
- B
- Correct answerC
- D
Solution
It is a gas law, which states that the pressure exerted by a gas of given mass of constant temperature is inversely proportional to the volume.
$p \propto \frac{1}{V} \text { or } p V=k$
[Pressure multiplied by volume equals constant $k$ ] We plot a graph between $p$ and $V$ constant temperature is illustrated below,
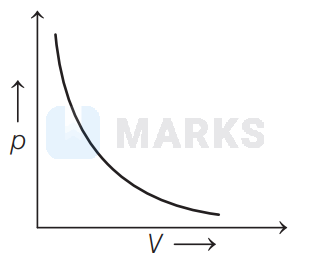
Hence, the correct answer is option: 'C'.