Q46 / 180 · KCET 2025 · Chemistry
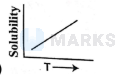
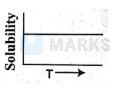
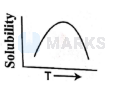
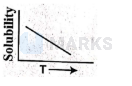
Variation of solubility with temperature $t$ for a gas in liquid is shown by the following graphs. The correct representation is
- A
- B
- C
- Correct answerD
Solution
Henry law solubility $\propto \frac{1}{\text { Temp }}$
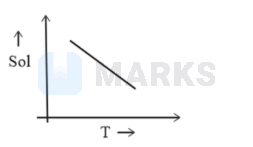
Hence, the correct answer is option: 'D'.