Q64 / 79 · NEST (NISER) 2026 · Physics
Two wave pulses, one rectangular and other triangular, approach each other as shown in the figure below.
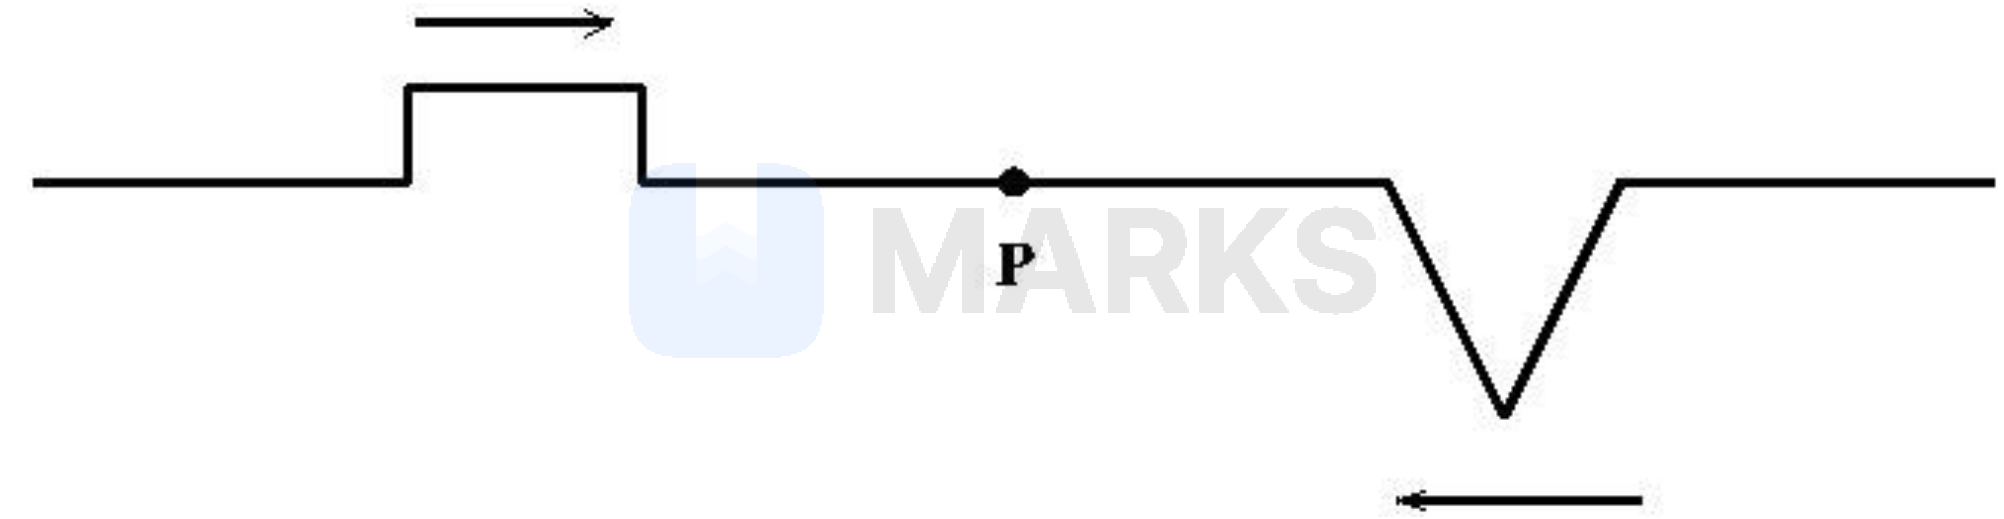
They overlap at the point P at time $t$. The diagram best representing the appearance of the wave pulses at a time $t' > t$ is
They overlap at the point P at time $t$. The diagram best representing the appearance of the wave pulses at a time $t' > t$ is
- A
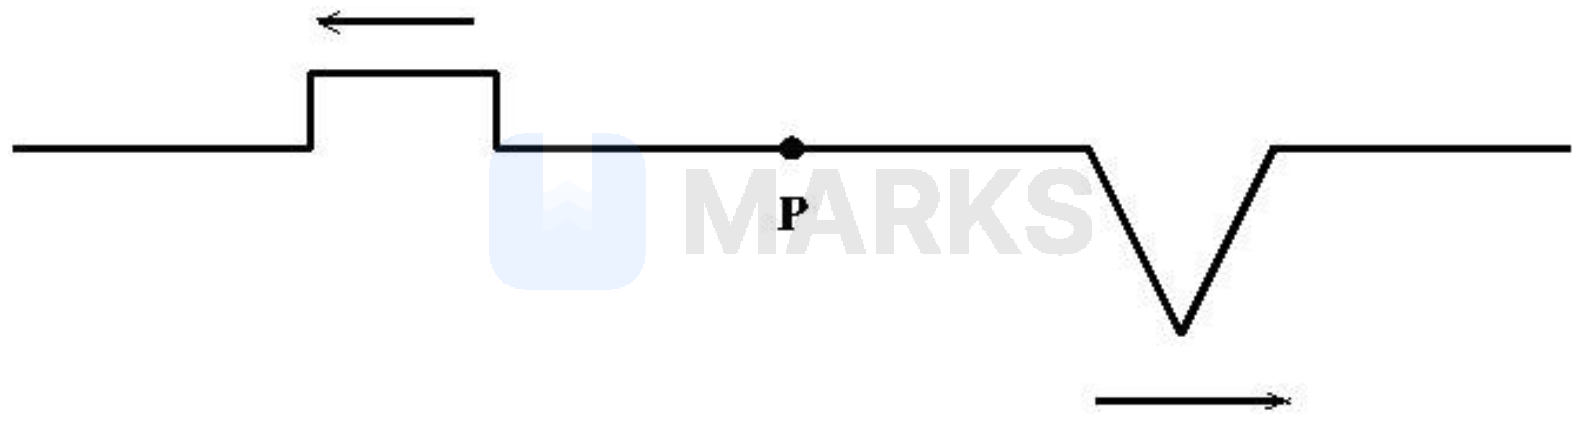
- B

- C

- Correct answerD
Solution
According to the principle of superposition of waves, when two wave pulses cross each other, they pass through one another without any permanent change in their shape, size, or direction of propagation.
Initially, the rectangular pulse is on the left side of point P and moving towards the right, while the triangular pulse is on the right side of point P and moving towards the left.
At time $t$, the two pulses overlap at point P.
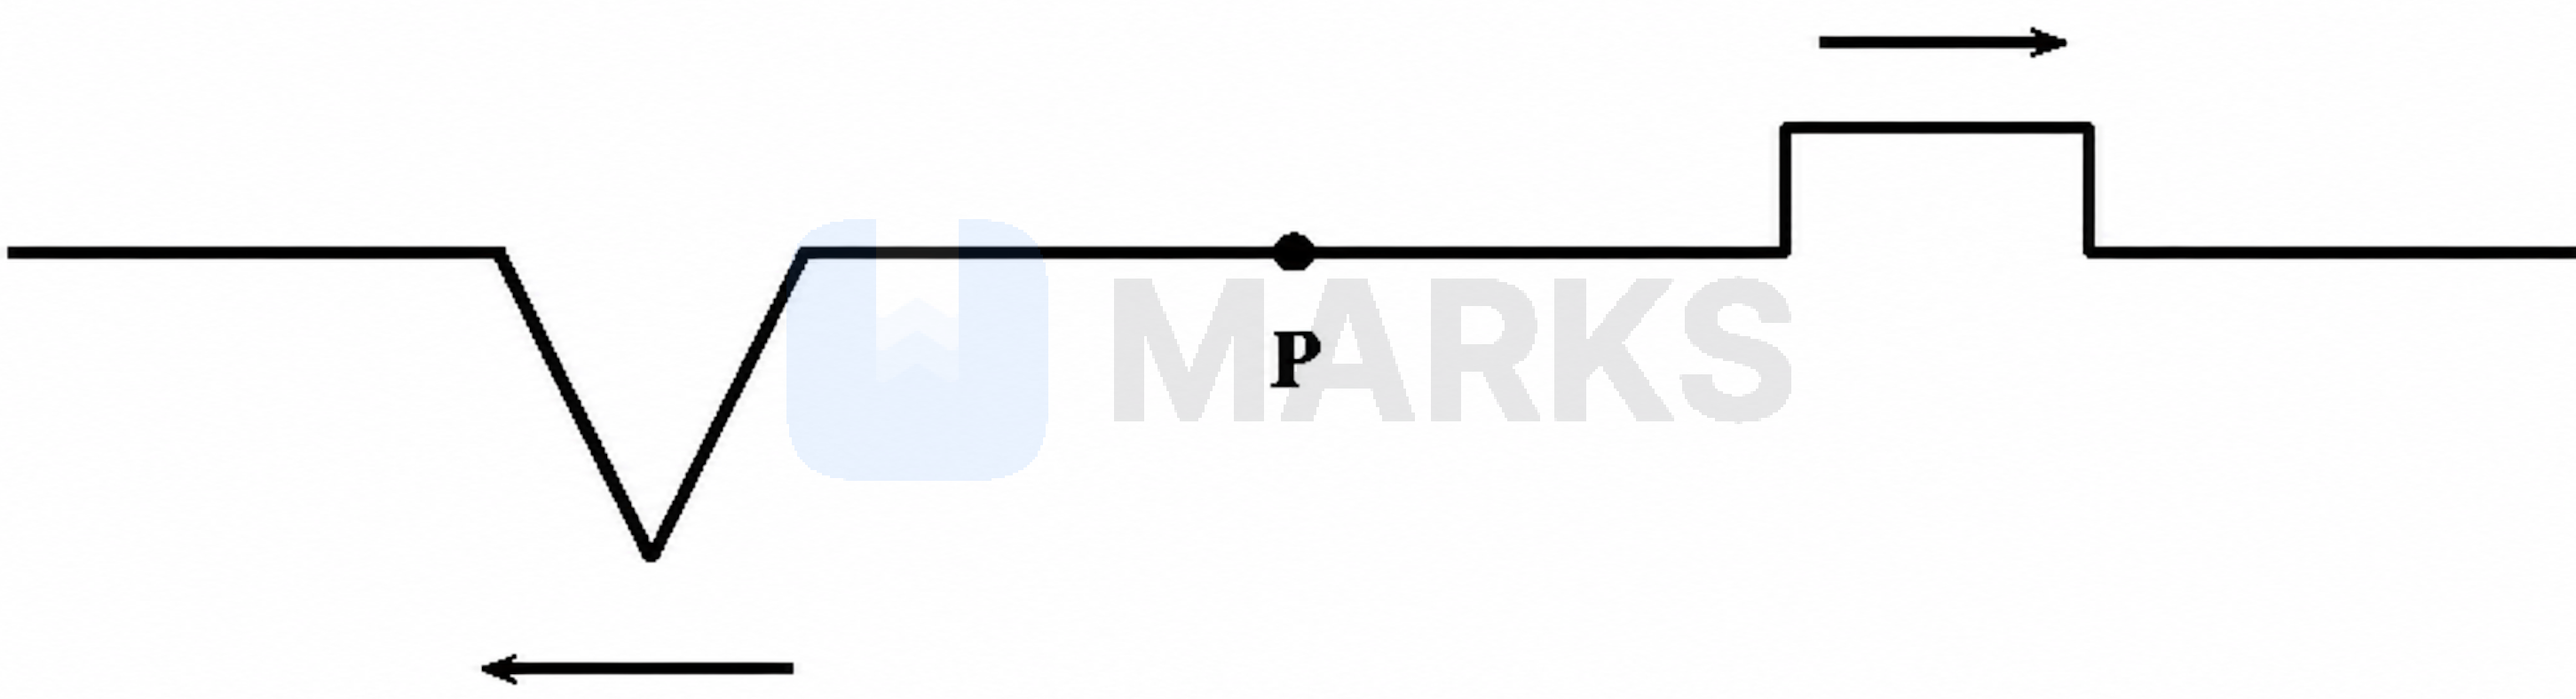
At a later time $t' > t$, the pulses will have completely crossed each other.
The rectangular pulse will have moved to the right of point P and will continue propagating towards the right.
The triangular pulse will have moved to the left of point P and will continue propagating towards the left.
This state is correctly depicted in option (4).
Answer :
Hence, the correct answer is option: 'D'.