Q121 / 155 · WBJEE 2026 · Physics
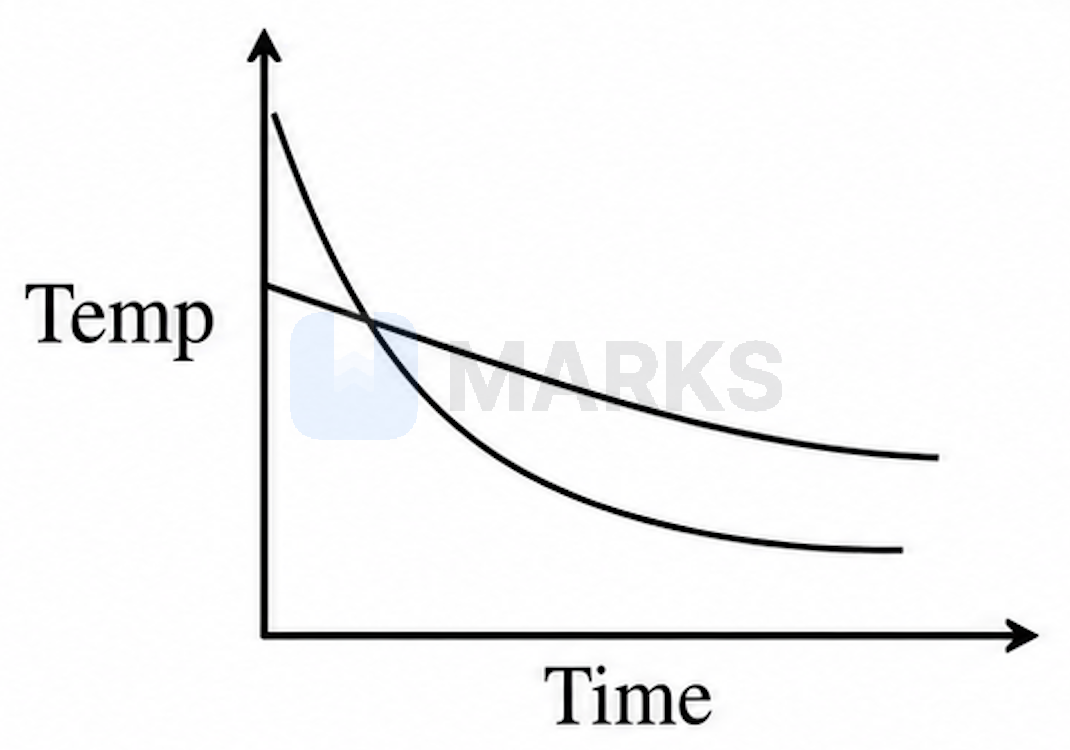
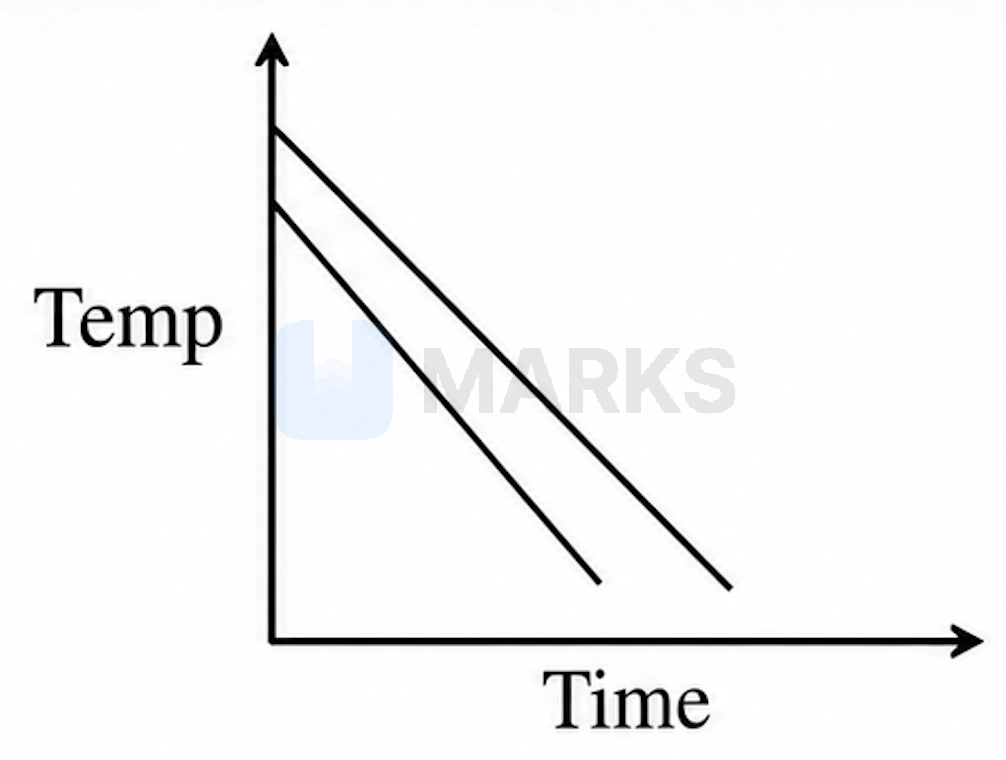
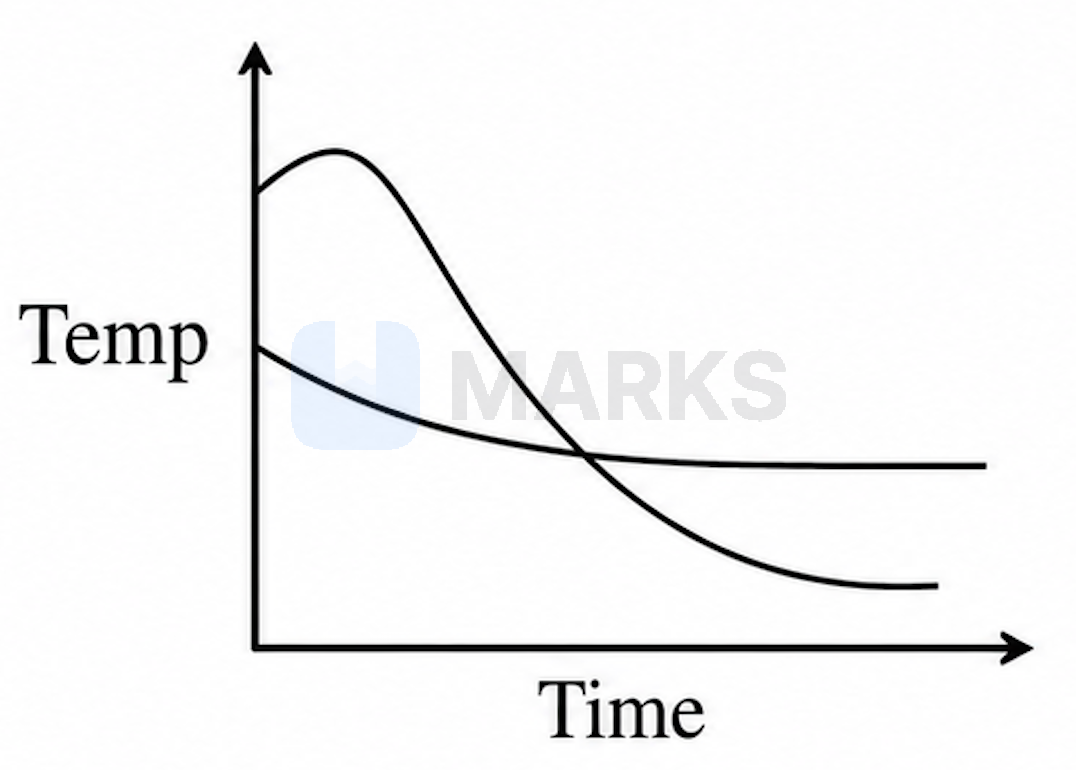
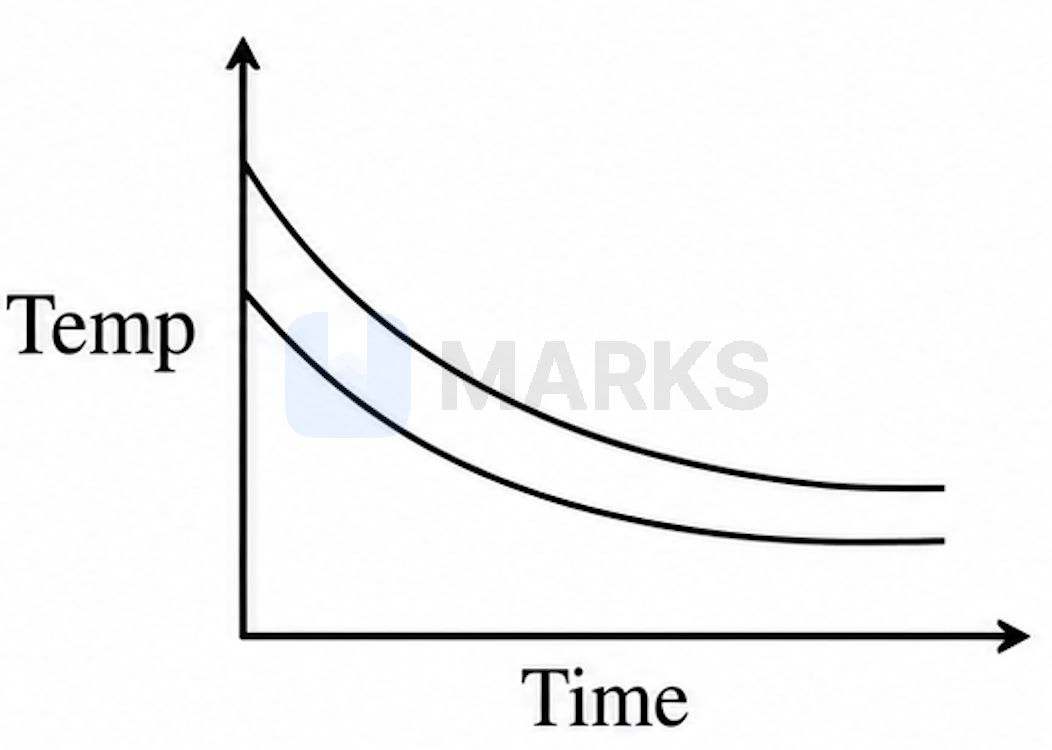
Two identical metal bars are heated in two different temperature and allowed to cool in the same surroundings. Which one of the following figures correctly shows their cooling curves?
- A
- B
- C
- Correct answerD
Solution
According to Newton's law of cooling, the rate of cooling of a body is directly proportional to the temperature difference between the body and its surroundings.
The temperature $T$ of the body at any time $t$ is given by the equation:
$T = T_0 + (T_i - T_0)e^{-kt}$
where $T_0$ is the temperature of the surroundings, $T_i$ is the initial temperature of the body, and $k$ is a positive constant that depends on the nature and area of the surface.
Since the two metal bars are identical, the cooling constant $k$ is the same for both.
Let the initial temperatures of the two bars be $T_{i1}$ and $T_{i2}$. The temperature difference between them at any time $t$ is:
$\Delta T = T_1 - T_2 = (T_{i1} - T_{i2})e^{-kt}$
Since $T_{i1} \neq T_{i2}$, the temperature difference $\Delta T$ will never be zero for any finite time $t$. This means the cooling curves will never intersect.
Furthermore, as $t \to \infty$, both $e^{-kt} \to 0$, so the temperatures of both bars will exponentially approach the same surrounding temperature $T_0$.
The graph in option (D) correctly represents two non-intersecting exponential decay curves that approach the same horizontal asymptote.
Answer:
Hence, the correct answer is option: 'D'.