Q46 / 59 · NEST (NISER) 2018 · Physics
The pressure $(P)$ versus temperature $(T)$ plot of a cyclic process for an ideal gas is shown in the figure.
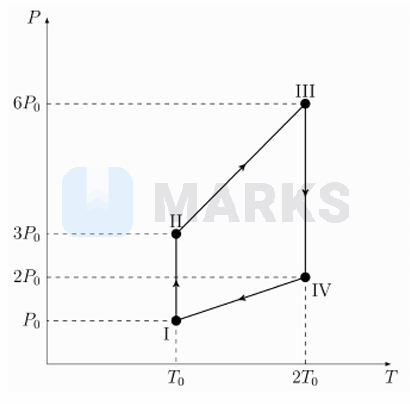
The corresponding density $(\rho)$ versus temperature $(T)$ plot will be
The corresponding density $(\rho)$ versus temperature $(T)$ plot will be
- A
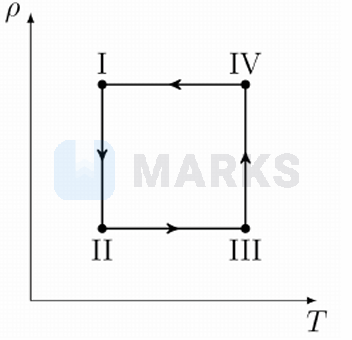
- Correct answerB
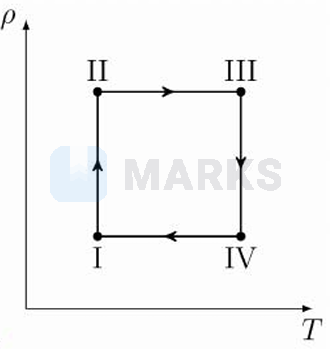
- C
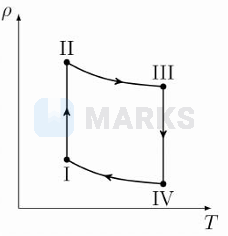
- D
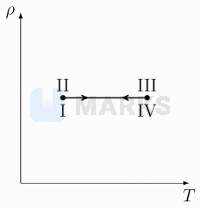
Hence, the correct answer is option: 'B'.