Q149 / 180 · COMEDK 2024 (Afternoon Shift) · Physics
The graph of an object moving with speed v for a time t is shown below.
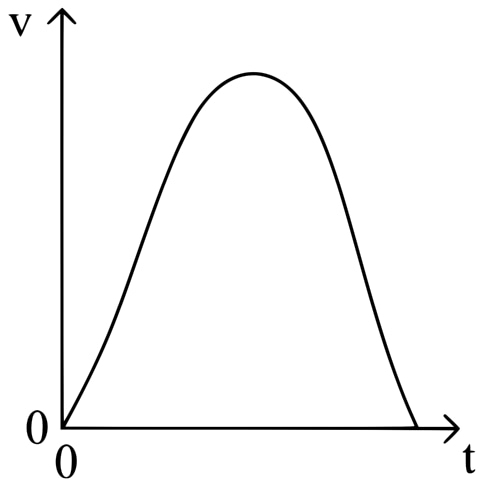 The graph that shows the distance s travelled by the same object for a time t is
- A
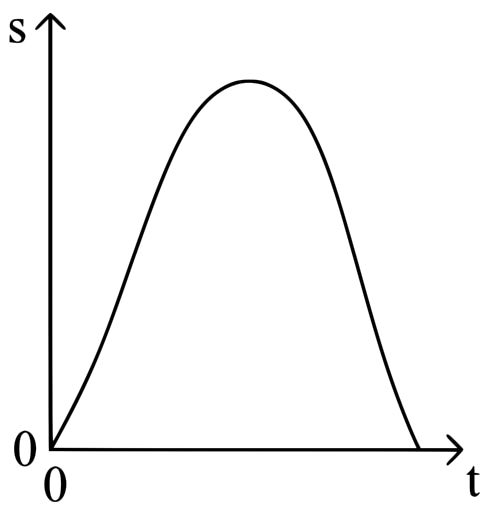
- B
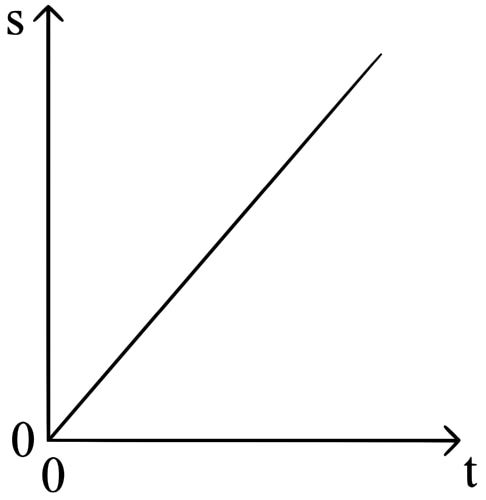
- C
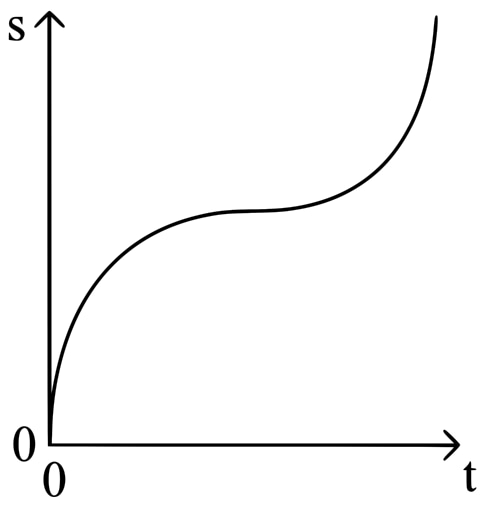
- Correct answerD
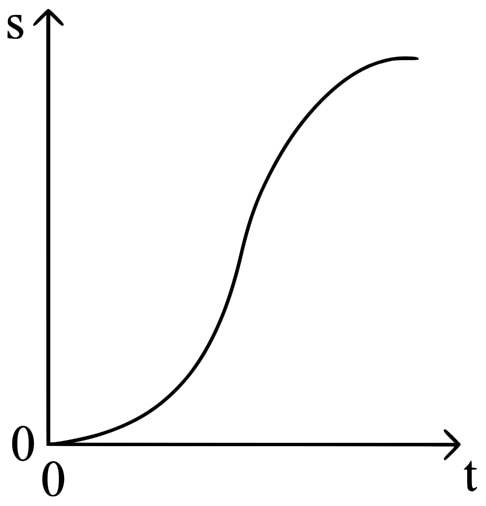
Solution
Since $v = \dfrac{ds}{dt}$, the slope of the $s$-$t$ graph equals speed at every instant.
At $t = 0$: $v = 0 \Rightarrow$ $s$-$t$ graph starts with zero slope (horizontal tangent).
First half (increasing $v$): slope of $s$-$t$ increases $\Rightarrow$ curve bends upward (concave up).
At peak $v$: steepest slope on $s$-$t$ graph (inflection point).
Second half (decreasing $v$): slope decreases $\Rightarrow$ curve bends downward (concave down).
At end: $v = 0$ again $\Rightarrow$ slope returns to zero (curve flattens).
Since speed is always $\geq 0$, distance never decreases. The $s$-$t$ graph starts flat, steepens, then flattens again — an S-shaped curve, which matches option (4).
Hence, the correct answer is option: 'D'.