Q105 / 270 · NDA 2012 (Phase 1) · General Ability
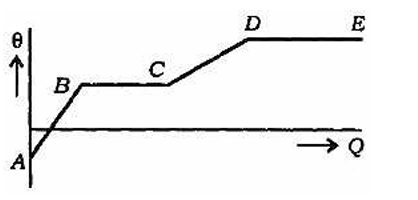
The graph given above indicates change in temperature $(\theta)$ when heat $(Q)$ was given to a substance. Which among the following parts of the graph correctly depict the latent heat of the substance?
The graph given above indicates change in temperature $(\theta)$ when heat $(Q)$ was given to a substance. Which among the following parts of the graph correctly depict the latent heat of the substance?
- AAB and BC
- Correct answerBBC and DE
- CCD and DE
- DDE and AB
Solution
The correct answer is option B.
Hence, the correct answer is option: 'B'.