Q158 / 160 · TS EAMCET 2025 (03 May Shift 2) · Physics
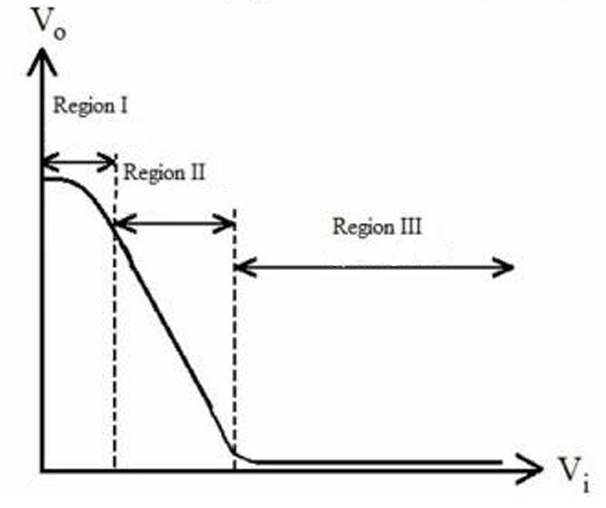
The graph between the input voltage $\left(\mathrm{V}_{\mathrm{i}}\right)$ and the output voltage $\left(\mathrm{V}_{\mathrm{o}}\right)$ of a transistor connected in common emitter configuration is shown in the figure. The active, saturation and cutoff regions of the transistor are respectively
- AI,II and III
- Correct answerBII,III and I
- CI,III and II
- DIII,I and II
Hence, the correct answer is option: 'B'.