Q7 / 55 · NEST (NISER) 2012 · Biology
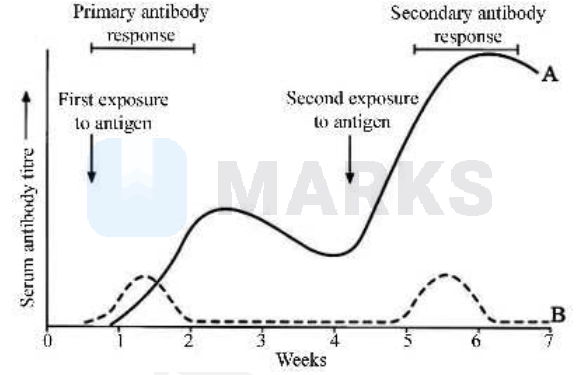
The graph below depicts serum antibody levels in a child after vaccination. Which antibody types do the curves A and B represent, respectively?
- A$\operatorname{IgA}, \operatorname{IgM}$.
- B$\operatorname{IgM}, \operatorname{IgG}$.
- C$\operatorname{Ig} A, \operatorname{IgE}$.
- Correct answerDIgG, IgM.
Hence, the correct answer is option: 'D'.