Q12 / 60 · IAT (IISER) 2019 · Biology
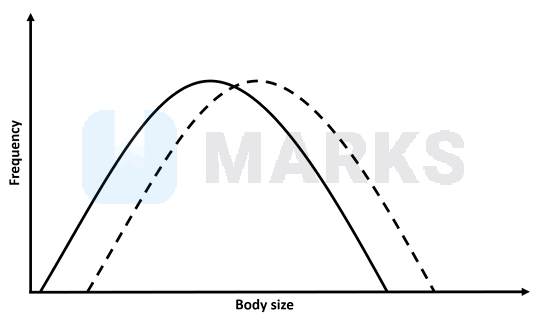
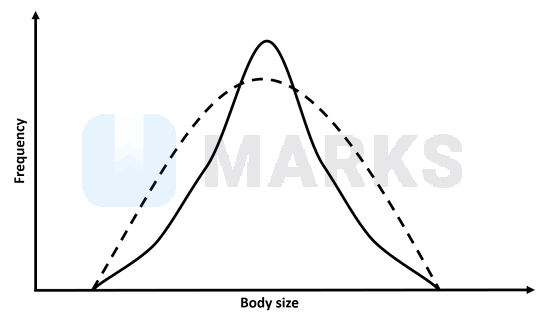
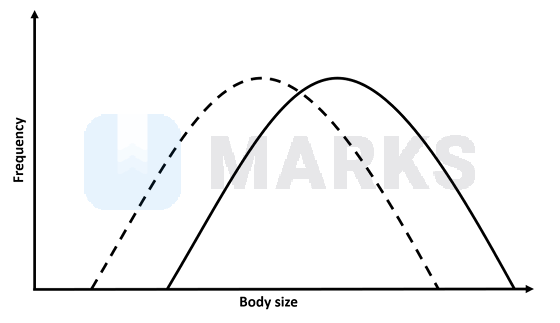
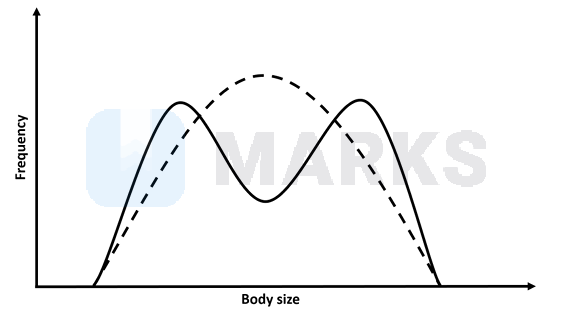
The following plots represent the body size distributions of a fruit fly population. Dashed lines represent the ancestral distributions and continuous lines represent the distributions after a few generations. If the larger individuals have better survival as well as higher reproductive rates, which diagram below best represents the expected change in the distribution of body size (X-axis represents body size while Y-axis represents frequency)?
- A
- B
- Correct answerC
- D
Hence, the correct answer is option: 'C'.