Q75 / 270 · NDA 2015 (Phase 2) · General Ability
The following figure represents the velocity-time graph of a moving car on a road:
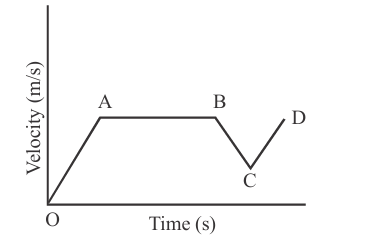
Which segment of the graph represents the retardation?
Which segment of the graph represents the retardation?
- AAB
- Correct answerBBC
- CCD
- DNone
Solution
The correct answers are option B
Hence, the correct answer is option: 'B'.