Q1 / 180 · AIIMS 2006 · Botany
The figure given below shows three velocitysubstrate concentration curves for an enzyme reaction. What do the curves $a, b$, and $\mathrm{c}$ depict respectively?
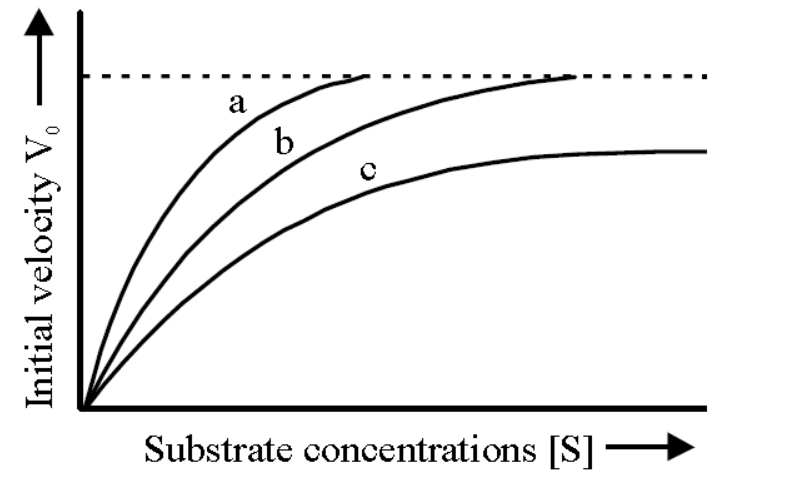
- Correct answerAa-normal enzyme reaction, b-competitive inhibition, c-non-competitive inhibition
- Ba-enzyme with an allosteric modulator added, b-normal enzyme activity, c-competitive inhibition
- Ca-enzyme with an allosteric stimulator, b-competitive inhibition added c-normal enzyme reaction
- Da-normal enzyme reaction, b-non-competitive inhibitor added c-allosteric inhibitor added
Solution
Enzymes or biocatalysts are proteinaceous substance that are capable of catalysing chemical reactions of biological systems without themselves undergoing any change. In the graph $a$ shows normal enzyme reaction, graph $b$ shows competitive inhibition and graph $c$ shows non competitive inhibition. In competitive inhibition the inhibitor, which is a substrate analogue, combines reversibly to the free enzyme at the active site. In non competitive inhibition, the inhibitor binds to enzyme at a place other than substrate binding site. It results in destruction of enzyme activity.
Hence, the correct answer is option: 'A'.