Q14 / 51 · JEE Advanced 2023 (Paper 2) · Chemistry
The entropy versus temperature plot for phases and at bar pressure is given. and are entropies of the phases at temperatures and , respectively.
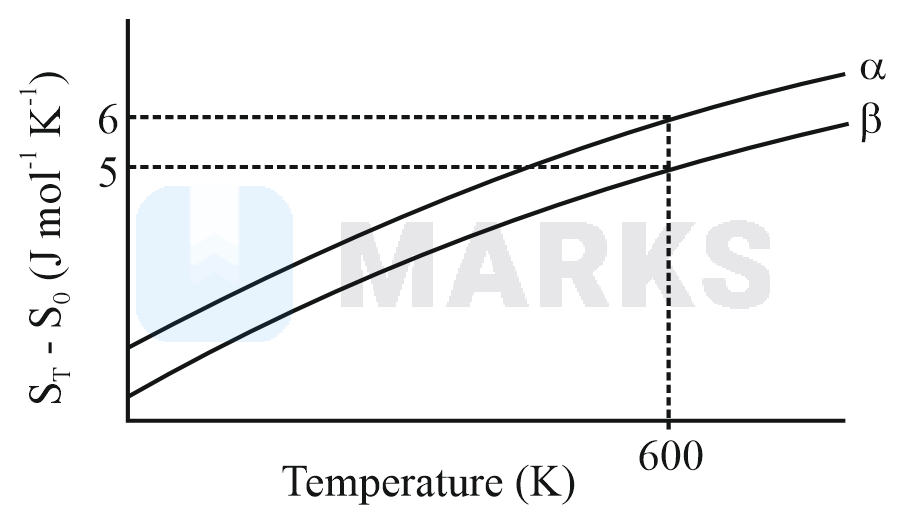
The transition temperature for to phase change is and . Assume is independent of temperature in the range of to and are heat capacities of and phases, respectively.
The value of entropy change, (in ), at is [Use: 0. Given: at ]
The entropy versus temperature plot for phases and at bar pressure is given. and are entropies of the phases at temperatures and , respectively.
The transition temperature for to phase change is and . Assume is independent of temperature in the range of to and are heat capacities of and phases, respectively.
The value of entropy change, (in ), at is [Use: 0. Given: at ]
Correct answer: 0.31
Solution
Now,
Given
at any temperature of
Hence, the correct answer is 0.31.