Q20 / 200 · NEET 2011 (Screening) · Botany
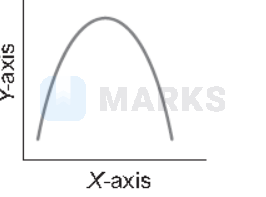
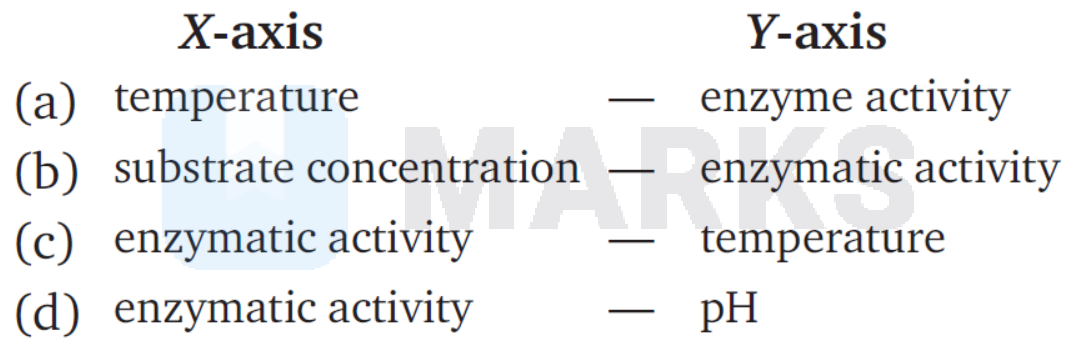
The curve given below shows enzymatic activity with relation to three conditions ( $\mathrm{pH}$, temperature and substrate concentration) What do the two axises ( $X$ and $Y$ ) represent?
- Correct answerA(a)
- B(b)
- C(c)
- D(d)
Solution
X-axis represent temperature and Y-axis represent enzyme activity. All enzyme act at an optimum temperature, above and below this temperature, the enzyme activity declines.
Hence, the correct answer is option: 'A'.