Q24 / 90 · JEE Main 2019 (12 Jan Shift 2) · Chemistry
The combination of plots which does not represent isothermal expansion of an ideal gas is
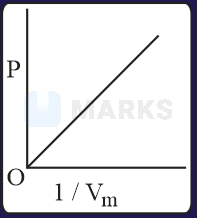
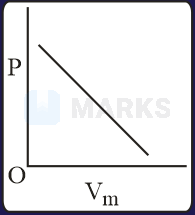
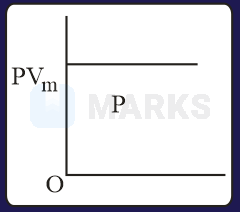
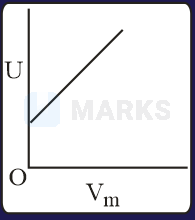
The combination of plots which does not represent isothermal expansion of an ideal gas is
- Aand
- Band
- Correct answerCand
- Dand
Solution
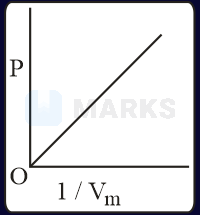
constant (isothermal expansion)
. The graph will be a straight line, . So, the above graph is correct.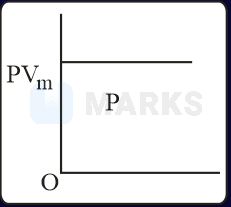
constant (isothermal expansion)
On increasing or decreasing , becomes constant. So, the above graph is correct.
graphs are correct.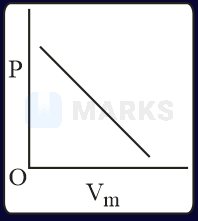
constant (isothermal expansion)
. The graph will be a straight line, . So, the above graph is incorrect.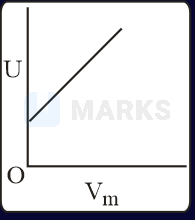
and for isothermal process, So, the above graph is incorrect.
Options are incorrect.
Hence, the correct answer is option: 'C'.