Q99 / 180 · AIIMS 2003 · Physics
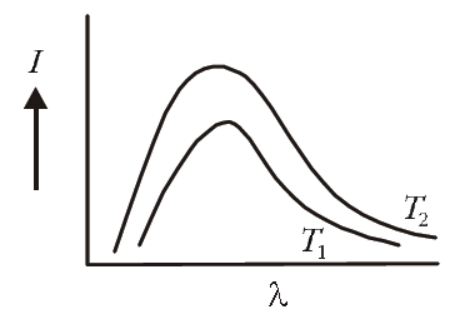
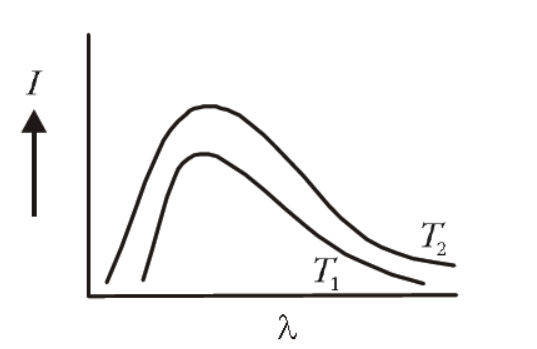
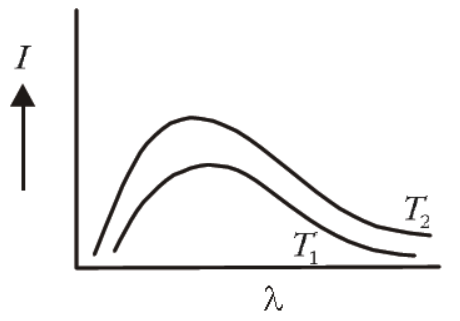
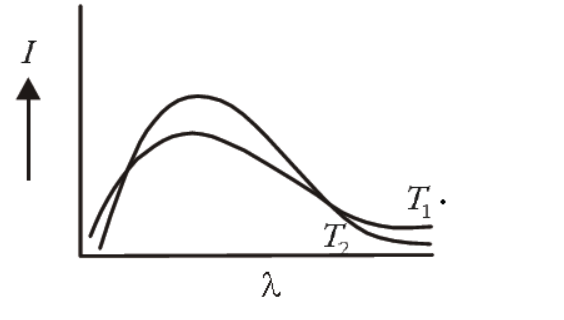
Shown below are the black body radiation curves at temperatures $T_1$ and $T_2\left(T_2>T_1\right)$. Which of the following plots is correct?
- A
- B
- Correct answerC
- D
Solution
From Wien's displacement law, we know that, $\lambda_m T=$ constant
which means that as temperature increases then the wavelength having the maximum intensity shifts towards left. Here, $T_2>T_1$.
$$
\therefore \quad \lambda_{m_{T_2}} < \lambda_{m_{T_1}}
$$
But in plot (a) $\lambda_{m_{T_2}}=\lambda_{m_{T 1}}$, in plot (b) $\lambda_{m_{T_2}}>\lambda_{m_{T_1}}$ and in plot (d) $\lambda_{m_{T_2}}>\lambda_{m_{\overparen{1}}}$. Therefore the correct plot is (c) where $\lambda_{m_{T_2}} < \lambda_{m_{T_1}}$.
Hence, the correct answer is option: 'C'.