Q128 / 180 · JIPMER 2017 · Physics
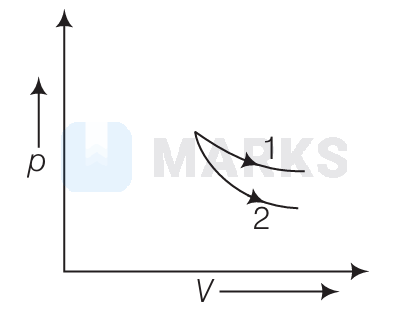
$p-V$ plots for two gases during adiabatic process as shown in figure plots 1 and 2 should correspond respectively to
- AHe and $\mathrm{O}_2$
- Correct answerB$\mathrm{O}_2$ and He
- CHe and Ar
- D$\mathrm{O}_2$ and $\mathrm{N}_2$
Solution
Slope of adiabatic process of $p-V$ diagram
$\left(\frac{d p}{d v}\right)=\gamma \frac{p}{V} \text { i.e. slope } \alpha \gamma$
From graph $(\text { slope })_2\gt$ (slope) $)_1$
$\Rightarrow \gamma_2\gt\gamma_1$
$\gamma$ for monoatomic gas (Ar, He) is greater than $\gamma$ for diatomic gas $\left(\mathrm{O}_2, \mathrm{~N}_2\right)$
Hence, the correct answer is option: 'B'.