Q142 / 180 · NEET 2026 (Re-NEET) · Physics
In Geiger-Marsden experiment, the number of scattered $\alpha$-particles $N(\theta)$ is plotted as a function of scattering angle $\theta$. Which of the following options represents the correct plot ?
- A
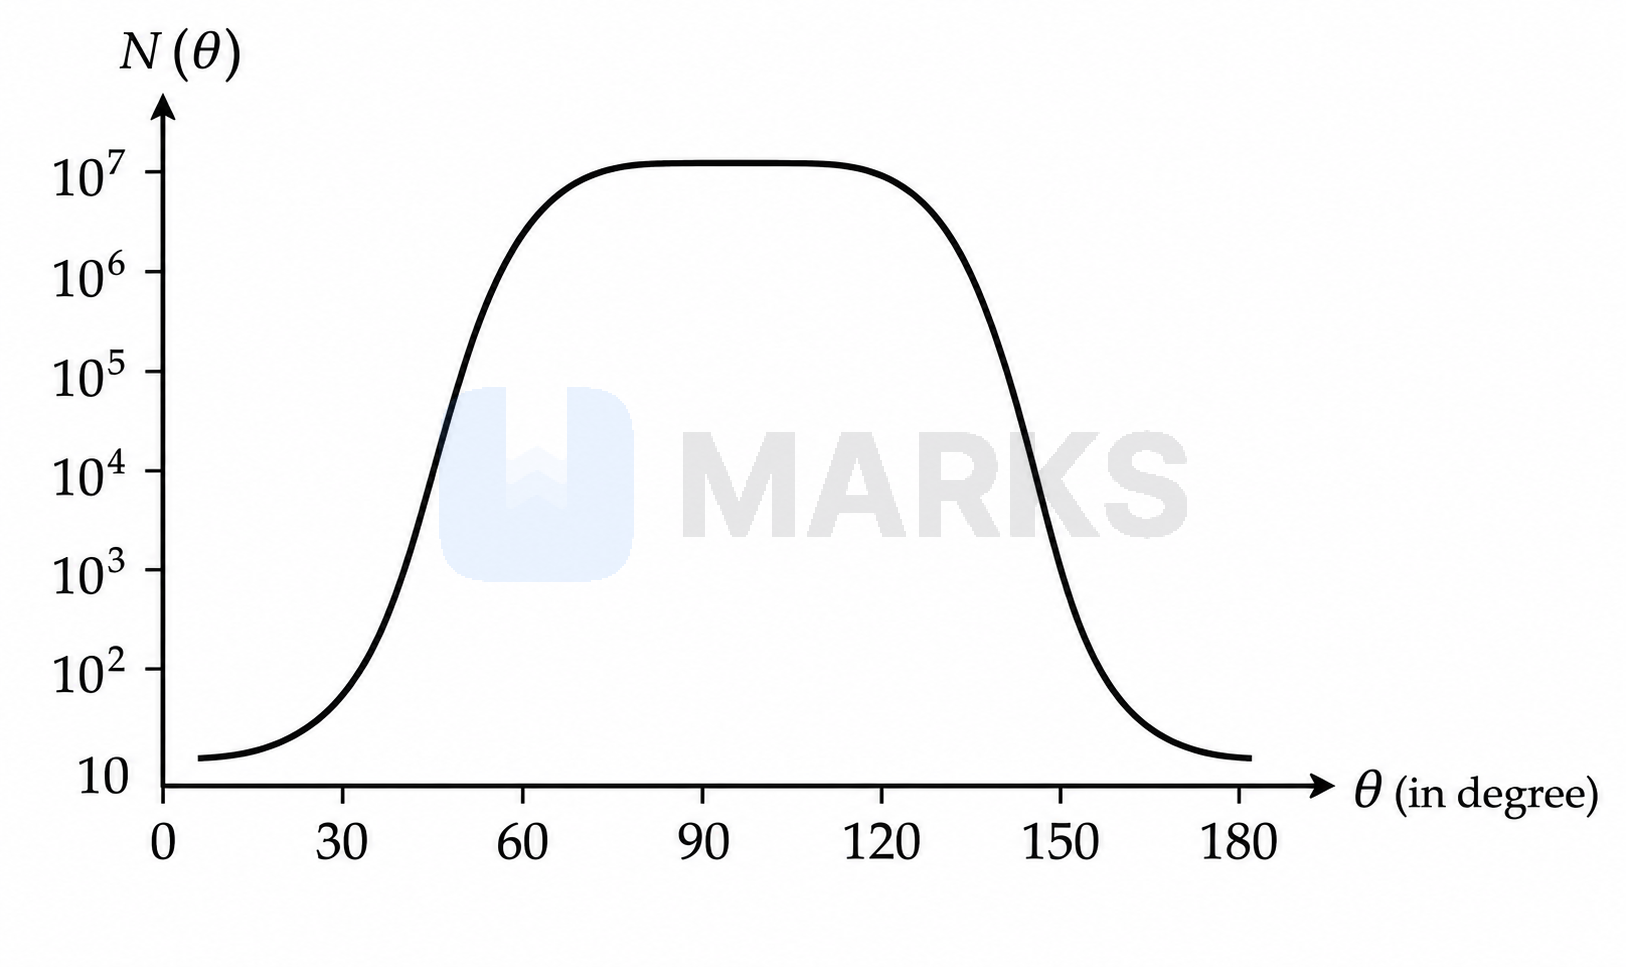
- B
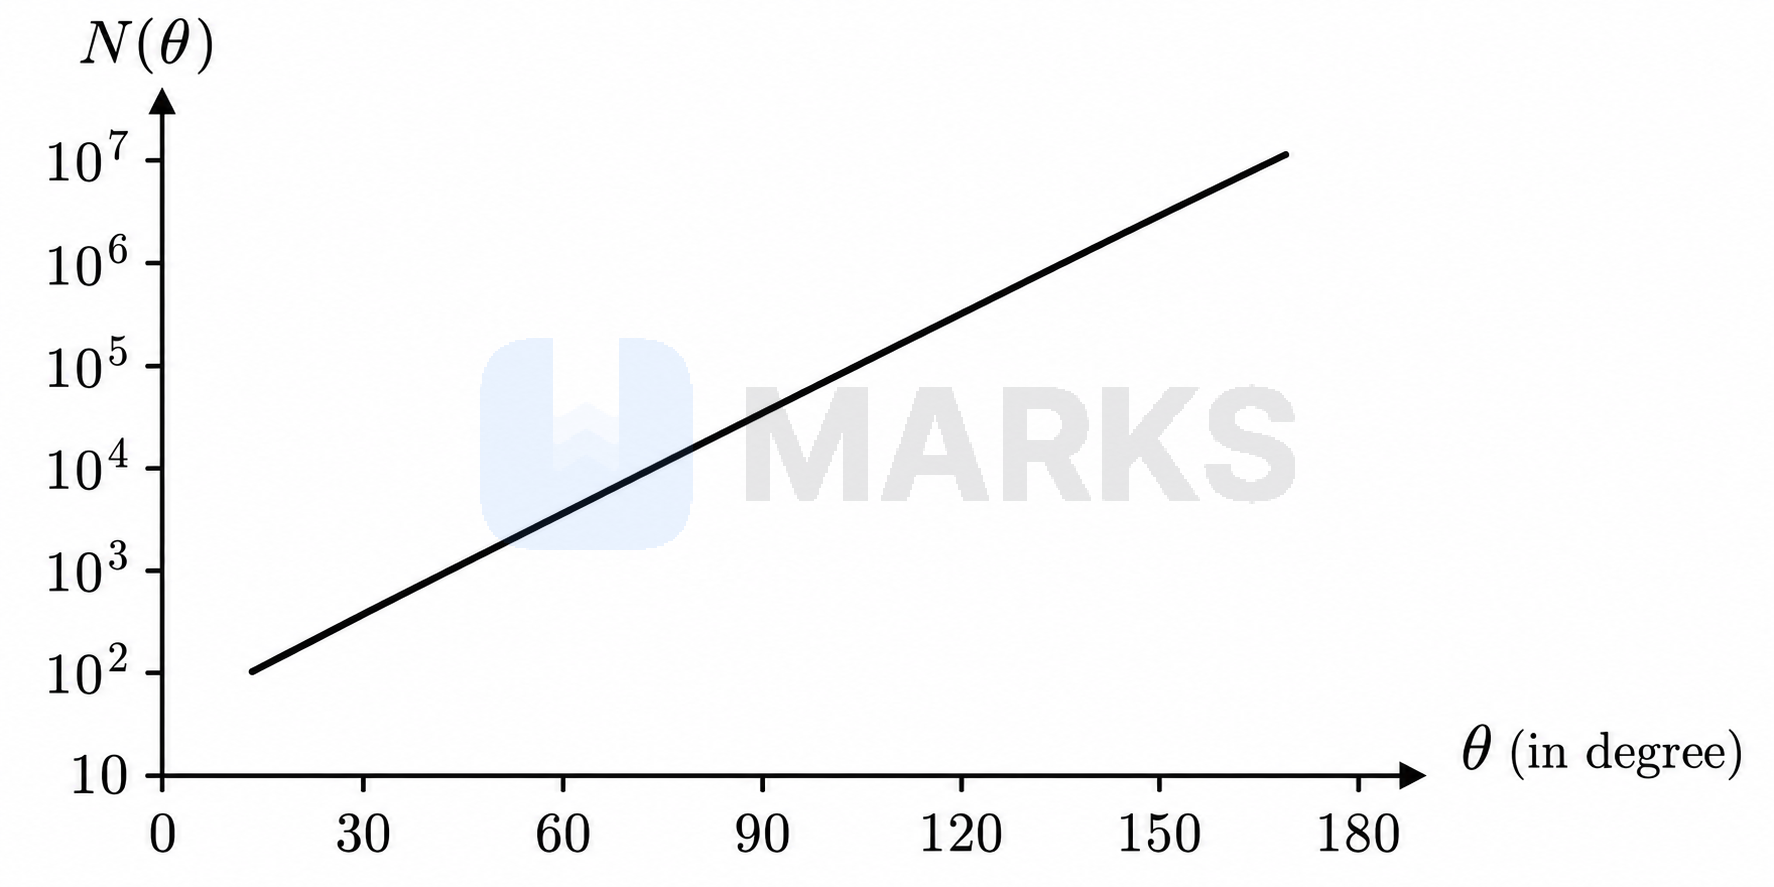
- C
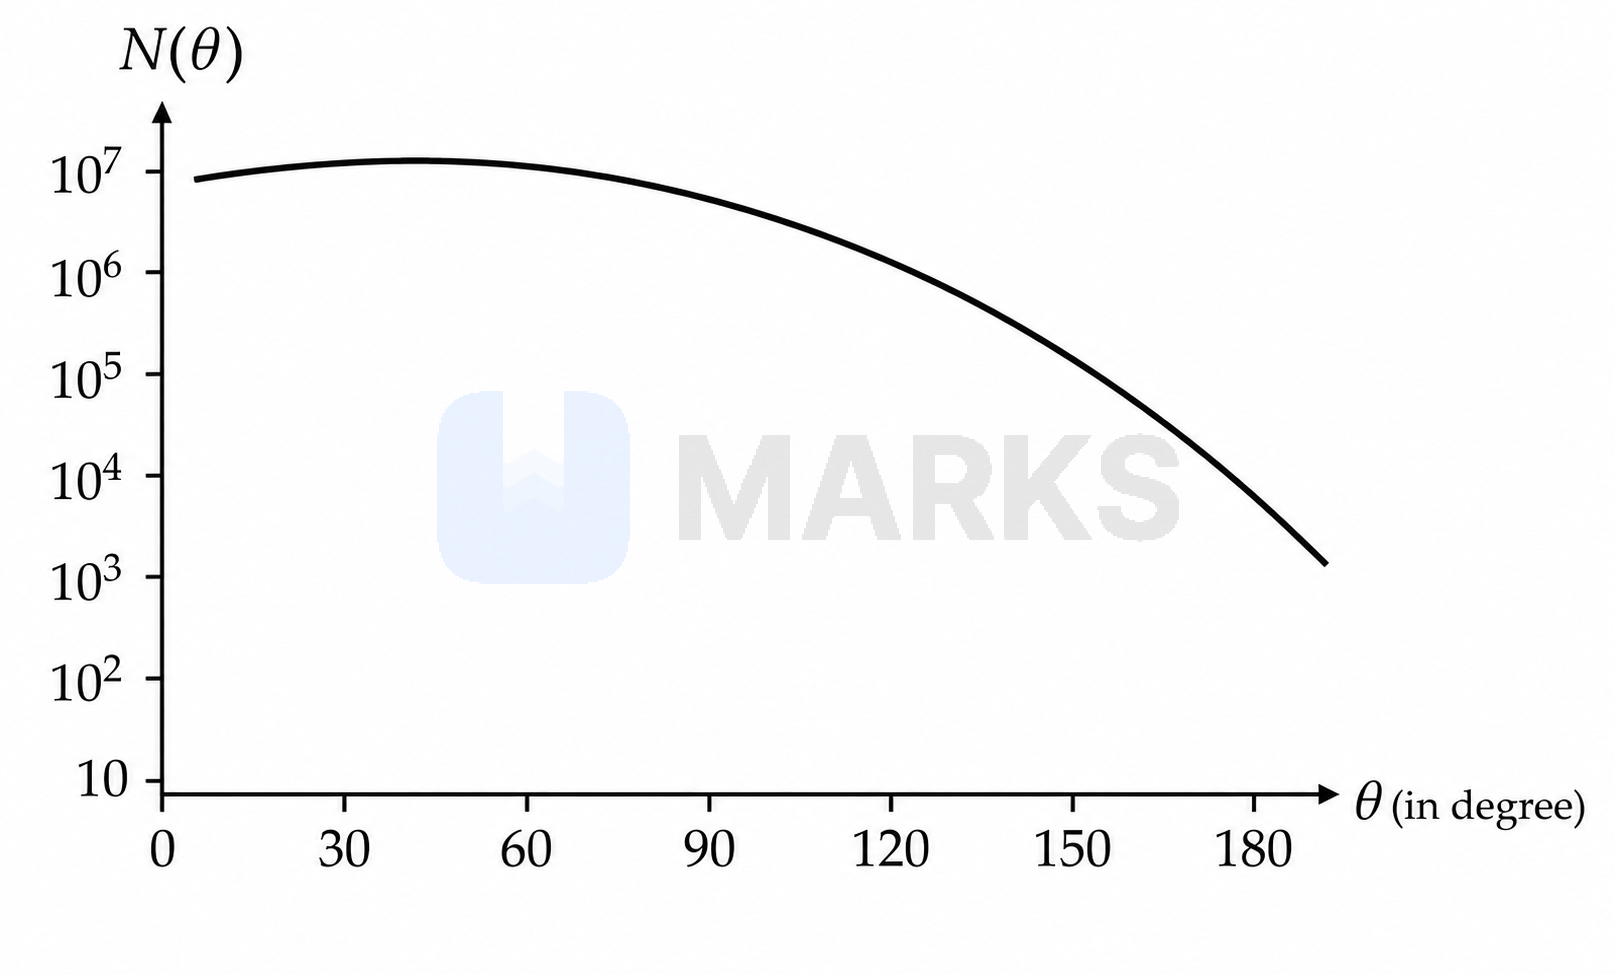
- Correct answerD
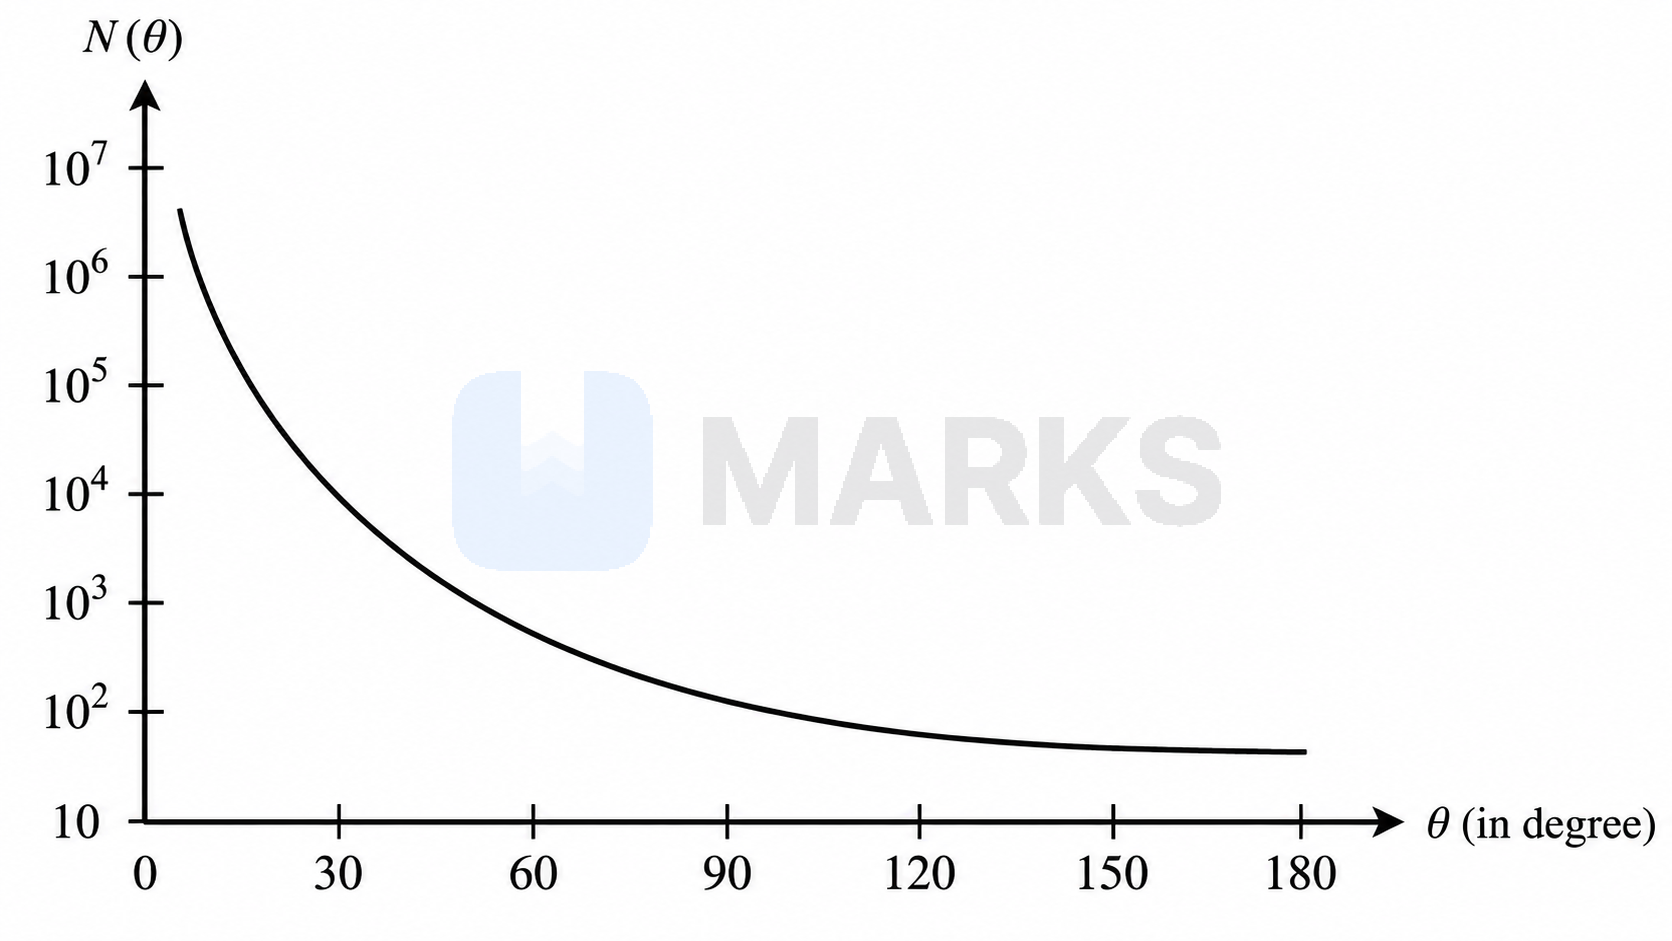
Solution
In the Geiger-Marsden ($\alpha$-particle scattering) experiment, the number of $\alpha$-particles scattered at an angle $\theta$ is given by the Rutherford scattering formula:
$N(\theta) \propto \dfrac{1}{\sin^4(\theta/2)}$
From this relation, we can observe the following:
1. For small values of $\theta$, $\sin(\theta/2)$ is very small, making $N(\theta)$ very large. Most $\alpha$-particles pass through with very little deflection.
2. As the scattering angle $\theta$ increases, $\sin(\theta/2)$ increases, causing the number of scattered particles $N(\theta)$ to decrease rapidly.
3. The minimum number of scattered particles occurs at $\theta = 180^\circ$, where $\sin(180^\circ/2) = \sin(90^\circ) = 1$.
The graph that correctly represents this rapid decrease from a very high value at small angles to a low value at large angles is shown in option (4).
Answer:
Hence, the correct answer is option: 'D'.