Q12 / 155 · WBJEE 2026 · Chemistry
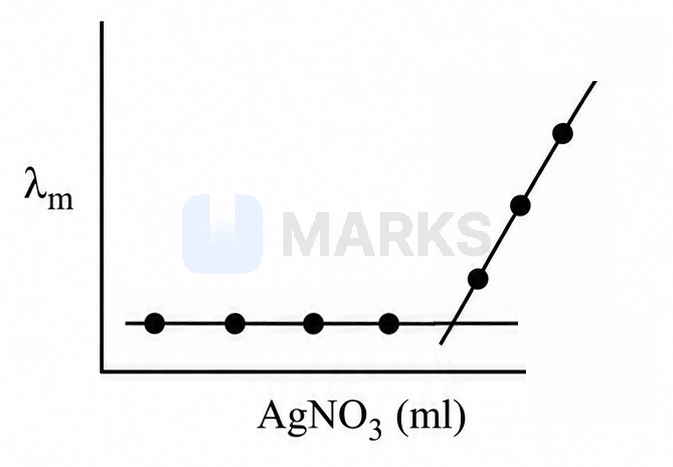
In a conductance experiment, aqueous $AgNO_3$ solution is added to aqueous $KCl$ solution gradually and simultaneously the molar conductivity $(\lambda_m)$ is measured. The correct plot of $\lambda_m$ versus volume of $AgNO_3$ solution is
- A
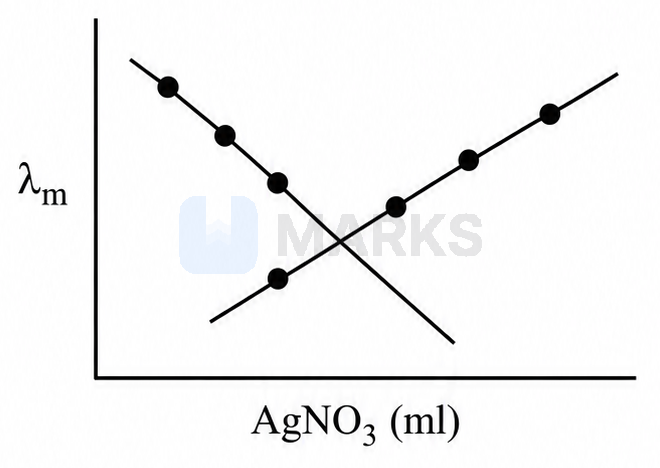
- B
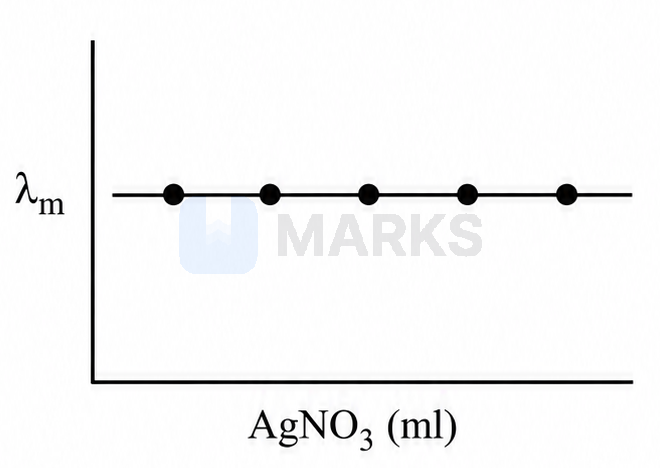
- C
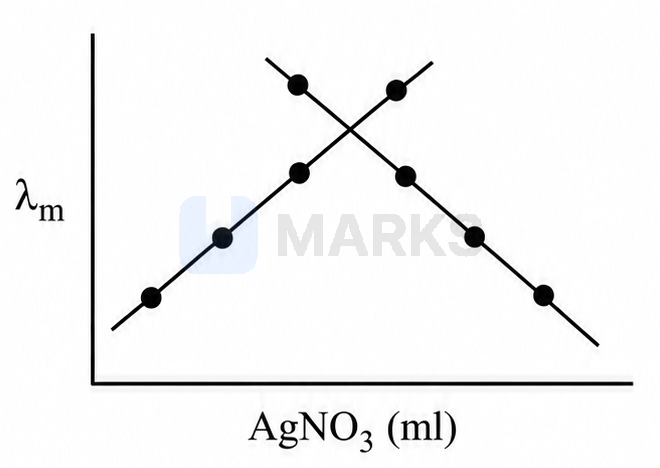
- Correct answerD
Solution
During the conductometric titration of aqueous $KCl$ with $AgNO_3$, the following reaction takes place:
$AgNO_3(aq) + KCl(aq) \rightarrow AgCl(s) \downarrow + KNO_3(aq)$
Initially, the conductance of the solution is due to $K^+$ and $Cl^-$ ions. As $AgNO_3$ is added, the $Cl^-$ ions are precipitated as $AgCl$, and they are replaced in the solution by $NO_3^-$ ions.
Since the ionic mobilities (and hence ionic conductances) of $Cl^-$ and $NO_3^-$ are nearly the same, the overall conductance of the solution remains almost constant before the equivalence point.
After the equivalence point, all the $Cl^-$ ions have been precipitated. Further addition of $AgNO_3$ introduces excess $Ag^+$ and $NO_3^-$ ions into the solution. This increases the total number of ions, leading to a sharp increase in the conductance.
Therefore, the plot of conductance versus the volume of $AgNO_3$ added will be a nearly horizontal line followed by a steeply rising line. This corresponds to the graph shown in option (D).
Answer:
Hence, the correct answer is option: 'D'.