Q4 / 75 · JEE Main 2026 (23 January Shift 2) · Chemistry
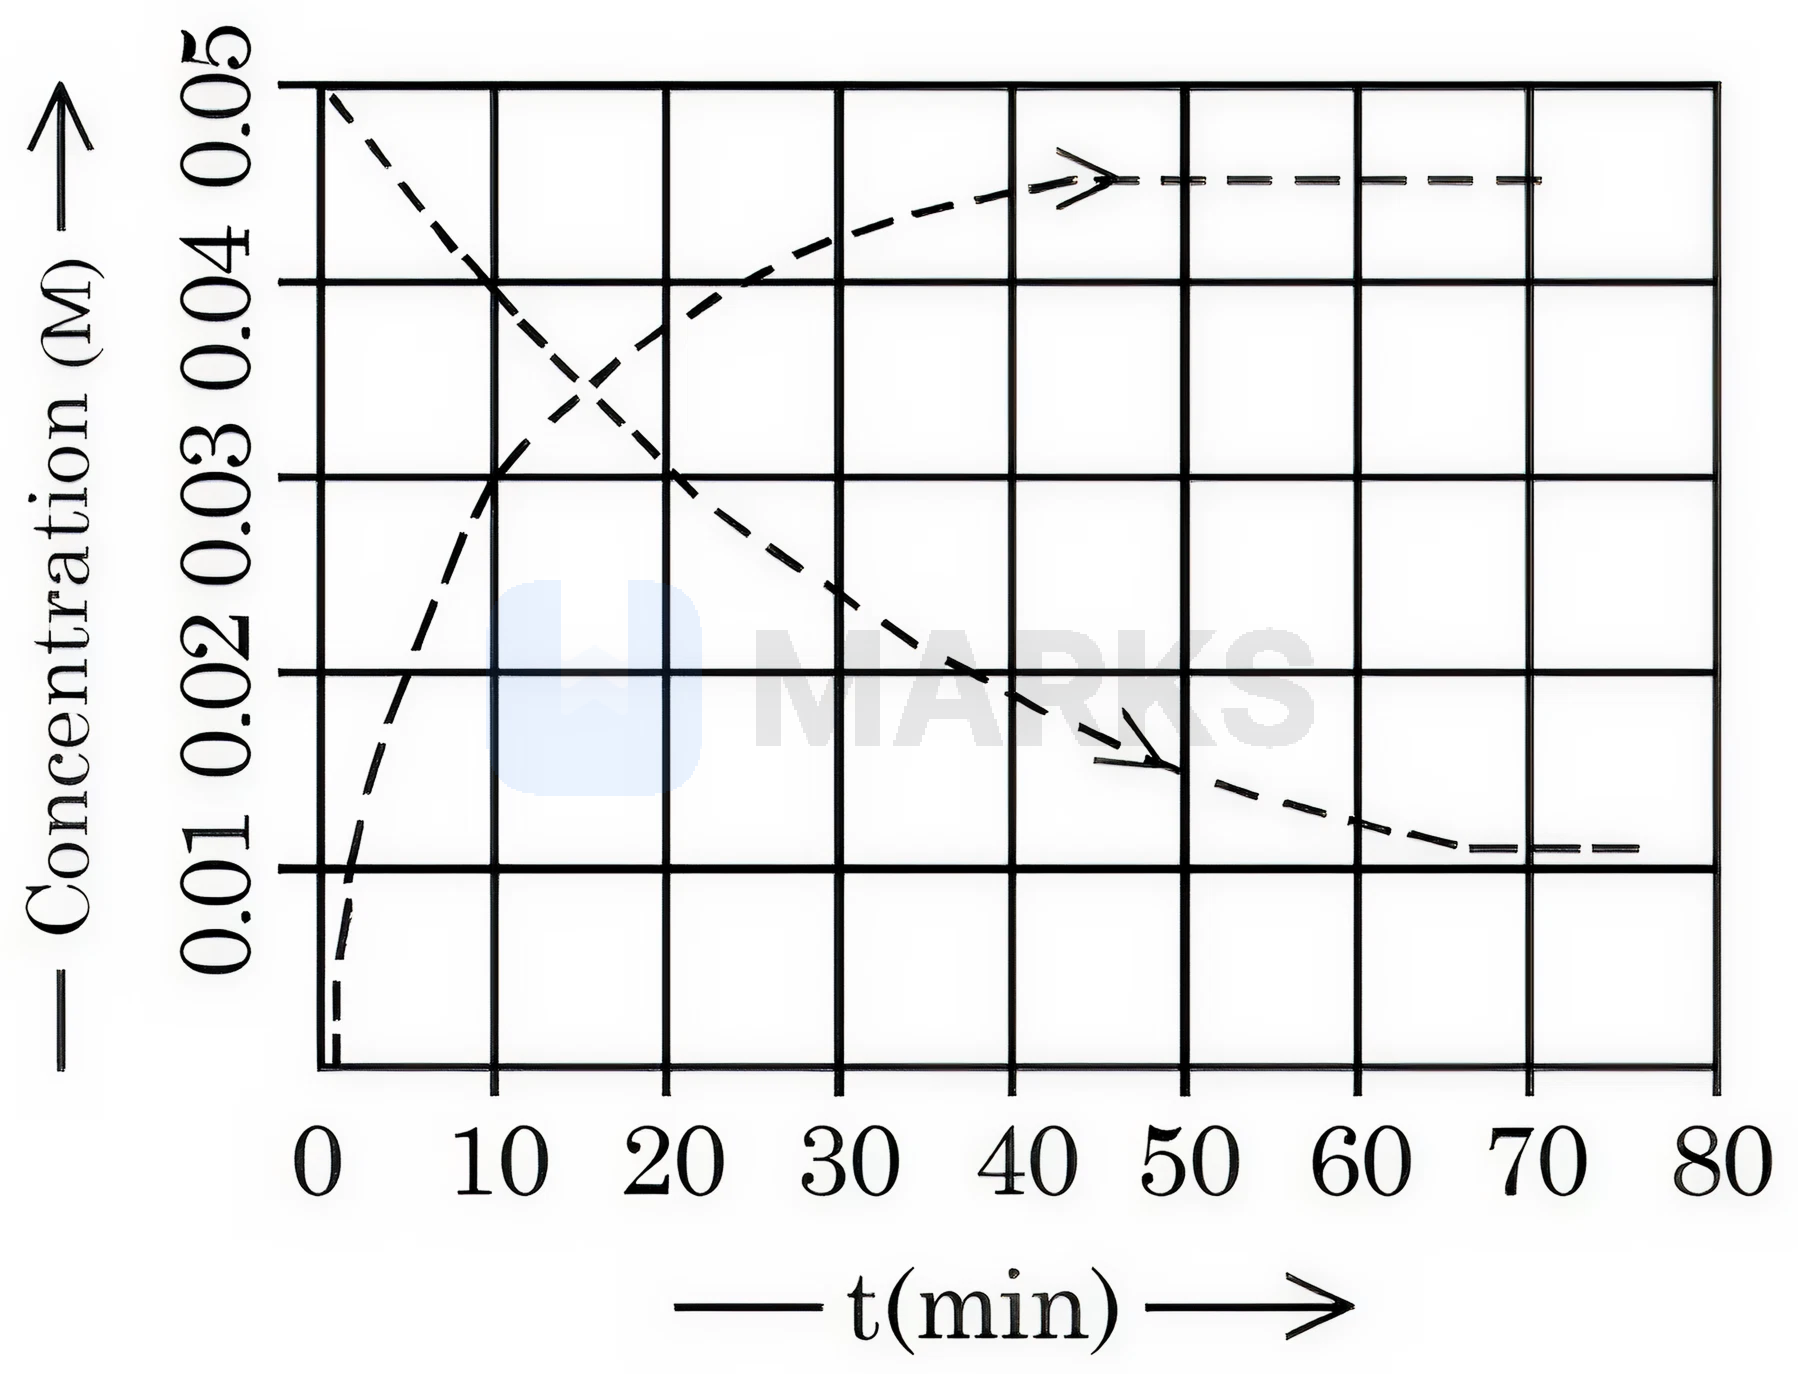
Given above is the concentration vs time plot for a dissociation reaction : $\mathrm{A} \rightarrow \mathrm{nB}$. Based on the data of the initial phase of the reaction (initial 10 min), the value of n is $\_\_\_\_$.
Given above is the concentration vs time plot for a dissociation reaction : $\mathrm{A} \rightarrow \mathrm{nB}$. Based on the data of the initial phase of the reaction (initial 10 min), the value of n is $\_\_\_\_$.
- Correct answerA3
- B2
- C4
- D5
Solution
$A \rightarrow nB$
At $t = 0$: $[A] = 0.05$ M, $[B] = 0$
At $t = 10$ min: $[A] = 0.04$ M, $[B] = 0.01 \times n$
From the graph, $[B]$ at $t = 10$ min $= 0.03$ M
$0.01 \times n = 0.03$
$n = 3$
At $t = 0$: $[A] = 0.05$ M, $[B] = 0$
At $t = 10$ min: $[A] = 0.04$ M, $[B] = 0.01 \times n$
From the graph, $[B]$ at $t = 10$ min $= 0.03$ M
$0.01 \times n = 0.03$
$n = 3$
Hence, the correct answer is option: 'A'.