Q3 / 155 · WBJEE 2026 · Chemistry
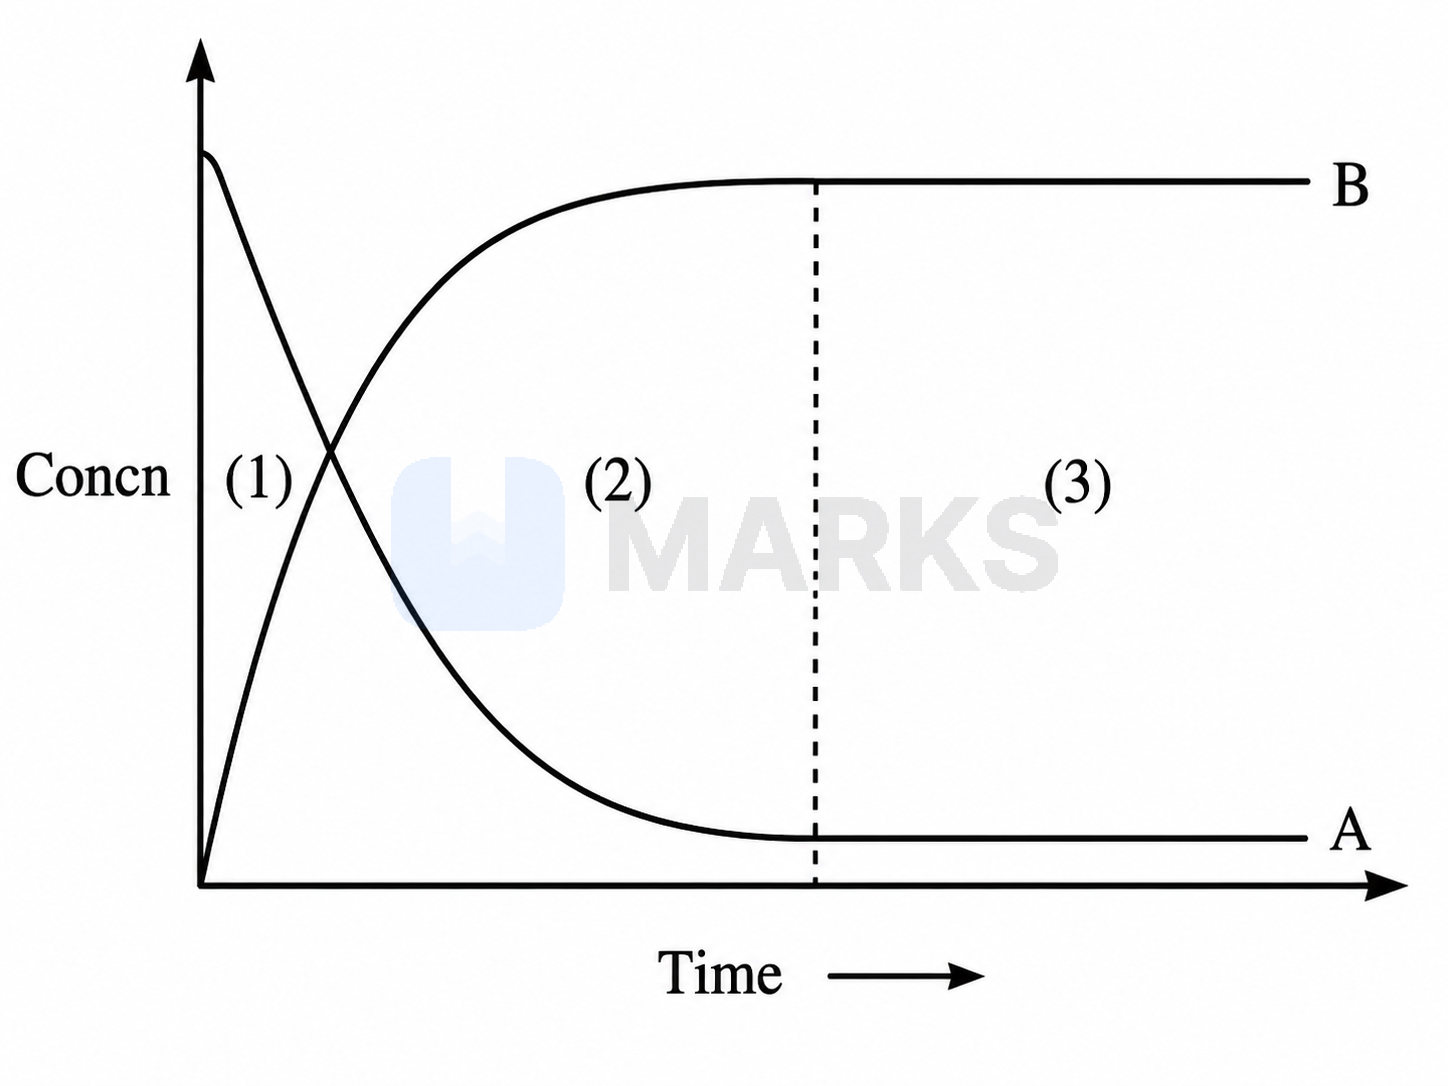
For the reaction $A \rightleftharpoons B$, variation of concentration is plotted against time as shown below.
Which of the following statements is true?
Which of the following statements is true?
- ARegion (1) indicates equilibrium
- BRegion (2) indicates equilibrium
- Correct answerCRegion (3) indicates equilibrium
- DBoth the Regions (2) and (3) indicate equilibrium
Solution
In the given graph, the concentration of reactant A decreases and the concentration of product B increases with time.
At equilibrium, the rates of the forward and backward reactions become equal, and the concentrations of both reactants and products become constant. They no longer change with time.
From the graph, it is evident that in region (1) and region (2), the concentrations of A and B are still changing. However, in region (3), the curves for both A and B become parallel to the time axis, indicating that their concentrations have become constant.
Therefore, region (3) indicates the state of equilibrium.
Answer: Region (3) indicates equilibrium
Hence, the correct answer is option: 'C'.