Q90 / 90 · JEE Main 2017 (09 Apr Online) · Physics
For the diagram given for an ideal gas
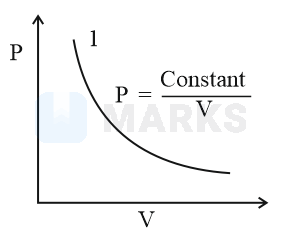
Out of the following which one correctly represents the diagram?
Out of the following which one correctly represents the diagram?
- A
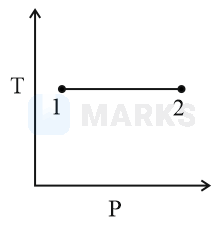
- Correct answerB
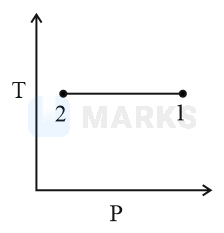
- C
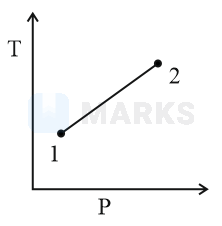
- D
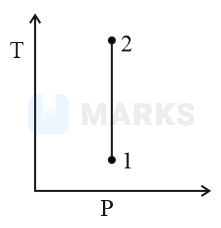
Solution
constant
at at
So, option is correct.
Hence, the correct answer is option: 'B'.