Q8 / 75 · JEE Main 2025 (29 Jan Shift 2) · Chemistry
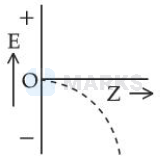
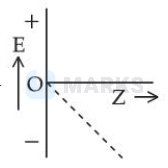
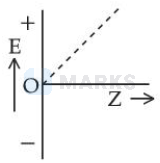
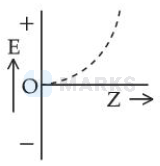
For hydrogen like species, which of the following graphs provides the most appropriate representation of E vs Z plot for a constant n ?
[E: Energy of the stationary state,
Z : atomic number, $\mathrm{n}=$ principal quantum number]
- Correct answerA
- B
- C
- D
Solution
$\begin{aligned} & E_n=-13.6 \frac{z^2}{n^2} \\ & E_n \propto-z^2 \\ & y=k x^2\end{aligned}$
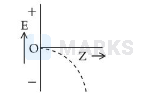
Hence, the correct answer is option: 'A'.