Q143 / 150 · MHT CET 2018 · Physics
Following graphs show the variation of stopping potential corresponding to the frequency of incident radiation for a given metal. The correct variation is shown in graph ( Threshold frequency)
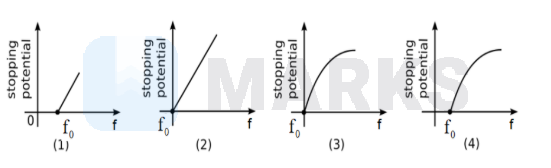
- Correct answerA(1)
- B(2)
- C(3)
- D(4)
Hence, the correct answer is option: 'A'.